Art/Research International: A Transdisciplinary Journal
Volume 4 Issue 1, 2019
QUILT/CARTOGRAPHY: USING CRAFTIVISM TO
EXPLORE FOOD INSECURITY ON A COLLEGE CAMPUS
Allison Ray Reagan
Texas Woman’s University
Allison Ray Reagan is a doctoral candidate in the Department of Sociology and Social
Work at Texas Woman’s University in Denton, Texas. Her research focuses on
Sociology of Health and Illness
(food insecurity) and Sociology of Teaching and
Learning in Higher Education
(arts-based-pedagogy, educational inequities and
instructional interventions).
Abstract: Quilt/cARTography emerged from an arts-based inquiry method for research
dissemination. I used quilt-making as an embodied craft and metaphor to illustrate how
crafting research is similar to piecing together neighborhood food environment data in
an undergraduate social statistics course. As an innovative pedagogical tool,
cARTographical quilts transform data into accessible tactile mediums that cross
disciplinary boundaries and educational levels to explore hunger on a college campus.
Keywords: arts-based pedagogy; embodied craft; quilting as a research metaphor;
undergraduate social statistics education
Quilt/cARTography
322
Art/Research International: A Transdisciplinary Journal
Volume 4 Issue 1, 2019
At the end of the day, do you want to spend all of your time and energy
producing work that is consumed by only an elite few who are just like you, and
likely only consuming your work to advance their own research agenda? (Leavy,
2015, p. 31)
Leavy’s (2015) quote about the consumability of research inspired me to create
the arts-based quilt/cARTography method for disseminating socially relevant data to
build knowledge in a more digestible way than reading a technical thesis. Similar to
Mol’s (2002) vision of the body multiple and the way in which illness/disease is enacted,
I theorize that epistemic access to statistical education also has multiplicities. From
Mol’s (2002) perspective, disease encompasses more than just the physician treated
physicalities. Disease in a human body is subject to an “interpretive reality” by the
physician(s) who enact disease and by the individual who experiences the illness (Mol,
2002). In the context of this paper, epistemic access to statistical education is
experienced by the instructor/researcher
who wants to make her research findings
Moreover, when enacted through
more accessible so that students can
craftivism, this arts-based method has
engage with the data to make connections
the potential to not only facilitate access
to course content. At the same time,
students enrolled in a social statistics
to knowledge building, but also serve as
course experience varying levels of access
an instructional technique for enhancing
to the statistical education. The objective of
student-instructor communication,
the quilt/cARTography method is to patch
rapport, and student self-efficacy.
holes in traditional statistics pedagogy so
that students can build their statistical
knowledge within a warm, supportive learning environment. Moreover, when enacted
through craftivism, this arts-based method has the potential to not only facilitate access
to knowledge building, but also serve as an instructional technique for enhancing
student-instructor communication, rapport, and student self-efficacy.
Within this case study, I approach teaching from an embodied arts-based
craftivist framework. I accomplish this by using a handcrafted quilt and quilting
metaphors to build epistemic access to statistical education and to disseminate food
access data to undergraduate social statistics students. While completing my master’s
degree in 2014, I learned about the significant social issue of inequities related to food
access and insecurity. I discuss my call to focus on this topic in greater detail within the
muse section of this paper. Food access on a university campus and within a half-mile
walking distance was the focus of my thesis and the data that I used to create the quilt/
cARTography.
Quilt/cARTography
323
Art/Research International: A Transdisciplinary Journal
Volume 4 Issue 1, 2019
The Muse: How I Came to This Project
For as long as I can remember, crafting has been a successful method for me to
understand, discuss, and create solutions for complicated issues. I learned at an early
age (as an extremely introverted adolescent) that when my words failed me, I could
craft hand-drawn, painted, or collaged illustrations to facilitate communication with
others. This skill set played a small role in the formulation of this project as it enabled
me to conceptualize and create the quilt. However, it was not the driving factor. My
impetus for embarking on this project, in short, could be described as a culmination of
observations which evolved over approximately 4 years. The project officially started
with my master’s thesis and is now a significant part of my dissertation. At that time, I
observed peers (graduate students who attended my university and the other university
in our town) who were struggling to feed themselves and their families. In addition to
taking graduate classes, most were also graduate teaching and/or research assistants.
It was not uncommon to hear these graduate students discuss the different coping
strategies (i.e., sharing books, dropping classes, taking out additional student loans,
food banks, working multiple jobs, food stamps/WIC, participating in human
pharmaceutical research studies, and donating plasma) they were using or had used in
the past to access sufficient quantities of food. As an undergraduate adviser, I observed
a similar pattern among undergraduate students as well: so much so, that I started to
keep snacks in my desk for students to eat during their advising sessions.
During that time, I also began to notice a trend within the dominant cultural
ideology that being an impoverished-hungry-suffering-student is a socially acceptable
rite of passage into adulthood
(Chaparro, Zaghloul, Holck & Dobbs,
2009). This
ideology is commonly portrayed in pop culture television and movies as well as in the
media. All too often we are socialized by the stereotypical “starving college student’”
persona portrayed by a group of individuals in their early 20’s, sitting around a thrift
store table eating ramen in their cramped one bedroom apartments (or dorm), studying
in between working multiple minimum wage jobs. This negative stereotype pervasively
dominates the current ideology by implying that hunger is just part of the long-standing
tradition that all college students must endure while waiting for their dream career to
materialize upon graduation. Over the last decade, statistics about the rate of food
insecurity among college students and the negative educational consequences warrants
the disruption of hegemonic beliefs which classify suffering and sacrifice as acceptable
stages within the traditional ‘hungry’ student experience.
Student observations coupled with the dominant negative cultural ideology
served as the foundation for a small-scale qualitative study that I completed with a
group of peers during my last semester of Master’s-level coursework. The focus of our
Quilt/cARTography
324
Art/Research International: A Transdisciplinary Journal
Volume 4 Issue 1, 2019
study was graduate students’ perspectives about hunger and food insecurity. The
findings from our qualitative interviews
(which included students from multiple
universities) were alarming. The finding of this class project resonated with me to such
an extent that I was driven to explore this issue further by making food access on
campus the focus of my thesis. After the thesis was completed, I used the data to create
a quilt to disseminate findings. My theorization about the way in which a quilt as a
dissemination method could also be used as a pedagogical technique evolved out of
observations as a doctoral student while teaching social research and social statistics
courses. Students made statements such as:
I have dreaded this class so much, that I put off taking this class until my last
semester.
I am only taking this class because it is required. I don’t need it for my career.
Honestly, I’m terrified. I’ve heard so many stories from other students about how
hard and useless taking statistics is.
This is my third time taking this class. I suck at math, but I just need to graduate.
I know you did not make the rules; you are just a teacher. But this is such a
waste of my time and money. I’ll never need to use statistics when I graduate.
These select statements represent a common pattern in responses uttered by students
during the first week of class as they respond to a short list of questions within their in-
class or online discussion board introductions. In my experience as a graduate teaching
instructor who has taught both social research and social statistics courses, we are
provided with an institutionally approved course description (i.e., course description
from the course catalog), departmentally defined student learning objectives, and the
departmentally selected (quantitatively focused) textbooks for our courses. From there,
it is our responsibility as the teacher of record to design a course that facilitates building
student knowledge to accomplish each of the student learning objectives. Typically,
within undergraduate social research and social statistics courses, assessment of
attained knowledge is centered on the students’ ability to successfully communicate
their analysis of socially relevant phenomena. Most often, this proof of knowledge is
disseminated in the form of a written research paper or essay.
I discovered a disturbing phenomenon that is common among undergraduate
students enrolled in both on-campus and on-line social statistics courses that appears
to serve as a significant barrier to successful course completion: a lack of epistemic
access. In other words, an epistemic access barrier exists that prohibits social statistics
students from accessing the knowledge ‘sold to them’ when they enrolled in the social
statistics course. I believe that the latter is an unintended consequence emanating from
strategic planning initiatives of the university meant to increase access to higher
education, consequences that can be minimized through instructional design.
Quilt/cARTography
325
Art/Research International: A Transdisciplinary Journal
Volume 4 Issue 1, 2019
Crafting a Quilt/cARTography Method
Quilting as a social act of meaning making and quilts themselves as social
artifacts are reported in the literature by researchers with multiple disciplinary
perspectives around the globe. The objective of this brief review of literature is to situate
the quilt/cARTography method within the broad field of arts-based inquiry.
Food Access and Food Insecurity
Coleman-Jensen, Nord, and Singh (2013) write about food insecurity as follows:
“at some time during the year household members were, at times, unable to acquire
adequate food for one or more household members because they had insufficient
money and other resources for food” (p. 8). Informally, the terms food insecurity and
hunger are used interchangeably. However, most research conducted after 1995, uses
the term food secure/insecure which is based on the USDA’s Core Food Security
Module (an 18-item survey to measure food insecurity)
(Eisenmann, Gundersen,
Lohman, Garasky & Stewart, 2011). Fortunately, students’ access to food on the
university campus that I originally measured in
2014 has increased slightly.
Unfortunately, on a national-level in the United States, the rate of food insecurity among
college students has increased. The detrimental educational and health consequences
of food insecurity prompted me to use craftivism. Recently, Dubick, Mathews, and
Cady’s (2016) seminal national study on food insecurity among college students who
attended both 2-year and 4-year institutions in the U.S., found that 48% of student
participants reported experiencing food insecurity within the last 30 days. Dr. Leslie
Frank reports high rates of student food insecurityin Canada;
49.5% of Acadia
University students who lived off campus were food insecure
(McMillan,
2016).
Researchers report that food insecurity negatively impacts students’ education in the
following ways: inability to purchase required text books (Dubick, Mathews & Cady,
2016), impaired concentration (Gallegos, Ramsey, & Ong, 2014; Maroto, 2013), lower
course grades
(Maroto,
2013), lower overall GPA
(Patton-López, Daniel, López-
Cevallos, Cancel-Tirado & Vazquez, 2014), and higher likelihood of dropout (Dubick et
al., 2016; Orszag, Orszag, & Whitmore, 2001).
Teaching and Learning Statistics in Higher Education
Over the past decade, emphasis has been placed on statistical education reform
in an effort to substantially improve the ways in which we educate undergraduate
students. This call for action yielded a significant body of pedagogical research that
identified problems for teaching and learning statistics and suggested instructional
Quilt/cARTography
326
Art/Research International: A Transdisciplinary Journal
Volume 4 Issue 1, 2019
interventions. The common practice among instructors of focusing on mathematical
aspects of formula calculations and emphasizing the memorization of statistical rules
and processes without using introducing real-world data was identified as a significant
problem (Allen, Folkhard, Lancaster, Sherlock, & Abram, 2010). Researchers suggested
that the disempowerment of memorization absent data resulted in students who could
not access epistemic content knowledge and therefore lacked the ability to apply
statistical processes to solve problems (Allen, Folkhard, Lancaster, Sherlock, & Abram,
2012). As such I embraced an experiential approach to learning which included the use
of real food insecurity data.
Quilt as a Metaphor
Within the past few decades, literature on the use of metaphors in teaching and
in research has demonstrated a variety of ways in which metaphorical thinking can be a
pedagogical technique to make knowledge more accessible. When incorporated into the
instructional design as a linguistic resource, metaphors shape the discourse and
facilitate the production of knowledge (Mouraz, Pereira, & Monteiro, 2013). Within post-
secondary courses, access to course knowledge involves students’ active engagement
with the epistemic structure and discourse of the disciplinary field (Mouraz et al., 2013).
In other words, instructors act as translators who clarify course knowledge by re-
contextualizing it in an effort to build a common understanding. Ausband (2006) and
Sommer’s (1997) articles present compelling rationales for the effectiveness of quilting
metaphors as a method for building novice researchers’ knowledge about the research
process. Ausband’s (2006) article draws our attention to the advantages of the
metaphor method; she elegantly simplifies the complicated processes of planning and
conducting research by outlining the metaphorical connections between crafting a quilt
and crafting qualitative research. She does this with illustrations and in-depth analysis of
the way in which the different processes and methods for creating a quilt relates to
processes and methods in qualitative research. Unlike Ausband’s (2006) personal
narrative, Sommers’ (1997) approach incorporates narratives of Amish women who
participated in a quilting bee to demonstrate the similarities between the quilting process
and the experiences of qualitative researchers.
Quilt as Dissemination Tool
Recognition is slowly expanding in the literature for arts-based quilts as an
effective method to disseminate data. For example, quilts and quilting have been
utilized as a dissemination tool to make broad societal connections with research
focused on anorexia (Saukko, 2000), unwanted sexual experiences (Koelsch, 2012),
and climate issues (Zaenker & Vladis, 1998). Koelsch (2012) suggested that when
Quilt/cARTography
327
Art/Research International: A Transdisciplinary Journal
Volume 4 Issue 1, 2019
presenting qualitative research findings, a quilt can be used to situate individual
participant data as unique blocks but important components of the whole. Consequently,
Koelsch (2012) created a web-simulated clickable cyber-quilt. Each block of the quilt
represents participants’ experiences with unwanted sexual activity, sexual assault, and/
or rape. The craftivist method was also used by climatologists, Zaenker and Vladis
(1998) to visualize global temperature data, to foster collaboration among academics,
and to educate the public. The authors reported that the quilt enabled them to see
connections between climate history and potential future climate trends (Zaenker &
Vladis, 1998). According to Zaenker and Vladis (1998), a quilt is an ideal medium to
make complicated scientific climate results more accessible to a broad audience,
specifically those who are not familiar with academic writing and climate related
statistics.
In addition to using a physical quilt or cyber-quilt, within the scholarship of
teaching and learning, an abundance of current research supports the use of quilting
metaphors as an effective pedagogical technique (Ausband, 2006; Koelsch, 2012;
Lynch & Fisher-Ari, 2017; Mouraz, Pereira, & Monteiro, 2013; Navaneedhan, 2017;
Saukko,
2000). According to Navaneedhan
(2017), instructional designs which
incorporate metaphors enable students to build skills in higher-order thinking
(i.e.
synthesizing and analyzing), an invaluable skill, particularly important to courses like
social statistics. Additionally, Lynch and Fisher-Ari (2017) report a significant shift in
student understanding, and interestingly, metaphor as pedagogy was also positively
associated as a powerful tool for building nurturing relationships (Lynch & Fisher-Ari,
2017). A strong instructor-student relationship is a key factor in academic achievement
in statistics courses (Waples, 2016). Stipek (2006) notes that secure relationships not
only support persistence when students face difficult course material but also enhance
communication, thus encouraging students to ask for help when they need it.
The technological advances in this century have revolutionized the way in which
we live and learn. As a result, many college courses that were at one time only available
on campus can now be delivered online, and maps that were at one time only available
in printed form, are now available by accessing cell phone applications. The
digitalization of maps has changed the way they are used. No longer are maps
presented in static form; now they are interactive, and the content within the maps is
updated with computer algorithms. So, why in the digital age, is a quilt a better vehicle
for dissemination of information than a digital map, a pocket map, or a poster, which
could be carried, distributed, or posted?
Unlike a digital map (viewed on a small cell phone or small computer screen) or a
pocket map (printed on standard sized printer paper), the quilted/cARTography is a
large four foot by five foot, simple but eye-catching tactile artifact of data-driven art.
Quilt/cARTography
328
Art/Research International: A Transdisciplinary Journal
Volume 4 Issue 1, 2019
Further, unlike complicated GIS generated data maps which require prior advanced
knowledge to accurately read and understand, the quilted/cARTography is designed
from a minimalist-modern perspective, making it an accessible alternative for people
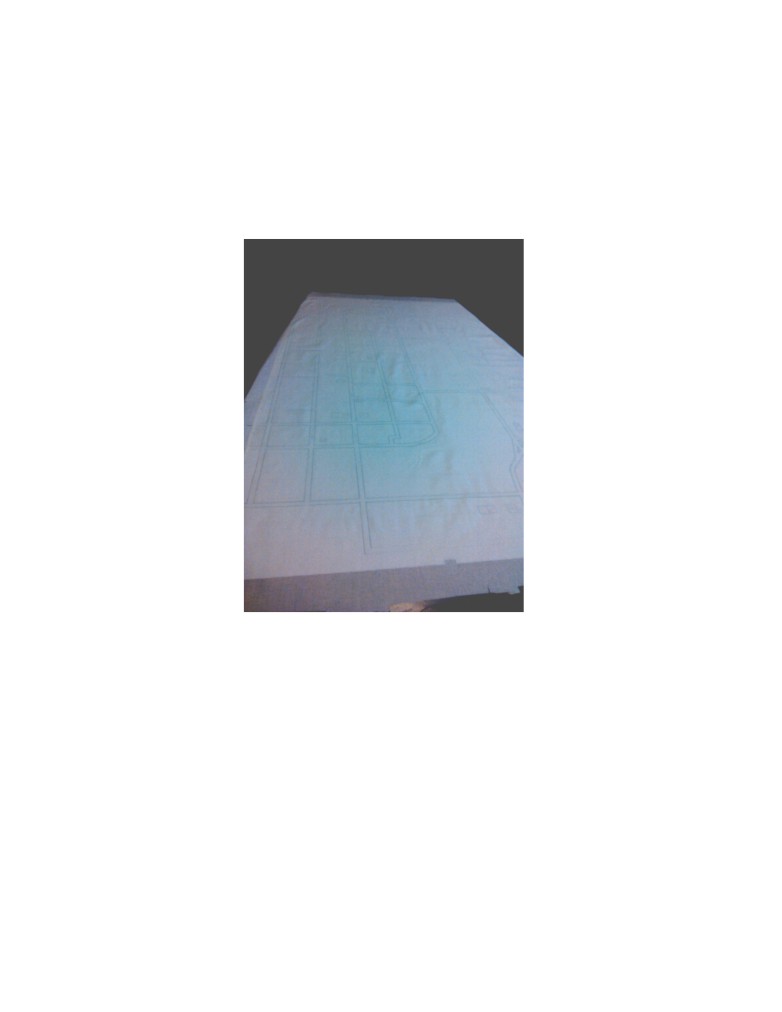
who are less quantitatively minded. Lastly, color posters and maps are not only non-
sustainable since they are printed on paper which is easily damaged after multiple uses,
but they are also extremely expensive to continually reproduce in large quantities for
distribution. In other words, the quilted/cARTography is a tactile, engaging, sustainable,
socio-spatial artifact that could last for a hundred years
(if packed properly), as
compared to the 50 inch by 44 inch professional presentation poster (see figure 1) that I
had printed prior to completion of the quilted/cARTography. Unfortunately, the poster
was significantly damaged in transit after my first presentation, and the cost for
replacement would have been $150 USD.
Figure 1. Poster to Disseminate Data
Quilt/cARTography
329
Art/Research International: A Transdisciplinary Journal
Volume 4 Issue 1, 2019
Realizing Quilt/cARTography Methodology
Quilting on the Bias: Reflexivity
In quilt making and research, bias is a significant factor that if not carefully
considered can distort the project and make it unusable. In quilt making, fabric is the
medium. Fabric is made by tightly weaving threads together crosswise and lengthwise.
This process results in a grain within the fabric which is secured from fraying with two
selvage edges. When cutting pieces from the fabric, the quilt maker cuts consistently by
following either the lengthwise or crosswise grain, so that the piece will hold its intended
shape. More often than not, quilt makers avoid crafting on the bias (i.e., bias grain in
fabric) which happens when one cuts at a 45 degree angle across the length or cross
grain of the fabric. Bias quilt pieces have a lot of stretch, and are easily mishandled by
even expert quilters.
Based on an epistemic perspective that knowledge is gained through a dynamic
process of experientialism (Savin-Baden & Major, 2013), I adopted a constructivist
approach to creating learning environments by incorporating craftivism-based
instructional design techniques to engender learning. Theoretically, a social artifact such
as a quilt/cARTography when enacted by craftivism, is an effective method to engage
students in a dynamic process of knowledge building. I acknowledge that some
researchers will view my position as inherently subjective. In my work I use a reflexive
research journal in addition to qualitative student data. I use the latter to document my
thoughts and feelings each time I use the quilt/cARTography method in a classroom
(Walker, Read, & Priest, 2013). In doing so, I follow Elliott, Ryan, and Hollway (2012),
who use reflexive field notes to conceptualize data within a co-created space of
researcher and participant.
Participants and Data Collection
I have shared the quilt/cARTography as research dissemination in the
community, at disciplinary conferences, in student research symposiums, as a guest
lecturer, as well as in multiple sections of social research and social statistics courses
that I have taught. The scope of this paper, which was reviewed by the University’s
institutional review board (Protocol # 20069), centers solely on classroom assessments
within the settings of undergraduate social statistics courses where I am the teacher of
record.
During the first week of class, I share with the students that I am a doctoral
student who is writing her dissertation about the sociology of teaching and learning
Quilt/cARTography
330
Art/Research International: A Transdisciplinary Journal
Volume 4 Issue 1, 2019
undergraduate social statistics in higher education. Specifically, my focus is studying
access (i.e., educational inequities, formal access and epistemic access), assessment
(i.e., pedagogical strategies and innovative assessment to facilitate learning), and arts-
based research methods. I also explicitly state that the classroom assessment data is
collected, but that all of the data is de-identified, and that since the research involves
normal educational practices, it does not require any out-of-class time commitment on
their part.
Crafting a Quilt/cARTography
Typically, the quilt-making process proceeds through the following stages.
Something sparks the crafting urge. This can range anywhere from fulfilling a practical
need (warmth, comfort, memorializing a life moment such as marriage or birth of a child)
to creative expression. Then the project is usually followed with a pattern and fabric
selection, along with determining the type of
quilting method (hand or machine sewing).
Fabric is then cut up into shapes which are
basted or sewn together to follow the pattern
to create a quilt top. The quilt is then
assembled by layering batting
(a type of
supportive material that gives the quilt
stability and body) and backing fabric which
covers the batting under the quilt top. The
three layers are quilted together with thread.
Once quilted, the edges of the quilt are then
covered with a thin strip of fabric and sewn
down to prevent the raw edges from fraying.
Given that there are many similarities
between crafting a map quilt and conducting
socio-geographical research, and given that I
have amassed a huge collection of leftover
materials from previous quilting projects, I
have the flexibility to use my leftover crafting
materials and bricolage research findings to
craft a new quilt. The process is illustrated in
Figure 2. Crafting a Pattern and Refining Details
figures 2-6.
Quilt/cARTography
331
Art/Research International: A Transdisciplinary Journal
Volume 4 Issue 1, 2019
Like most academic research in my discipline, after an extensive review of the
literature, I selected the research variables and defined measures so I could begin to
collect data. While I used many more variables in the written thesis, the main spatial
accessibility measures illustrated by the quilt included: existing pedestrian conditions,
university sponsored housing locations, and Campus Food Environment Measure (an
inventory that I created to collect density, variety and proximity data) (Ray, 2015).
In quilted-map-making and research, after the initial design process is completed,
it is critical to then ground (i.e., define) each element of the design so that the viewer
has a foundation to understand the work. I followed Griffin, Gruver, Dutton, College of
Earth and Mineral Sciences, and The Pennsylvania State University (n.d) lesson on
creating a visual hierarchy and selecting visual cues such as color and arrangement. My
goal was to produce a realistic (accurately scaled) map of the food environment, so I
Figure 3. Composition and Color
Quilt/cARTography
332
Art/Research International: A Transdisciplinary Journal
Volume 4 Issue 1, 2019
composed the quilt with a traditional grid layout and then selected color and value
contrasting fabrics. Griffin et al. (n.d) noted that the purpose of the map is closely tied to
the intellectual hierarchy of construction. I essentially selected achromatic gray scale
fabrics for the map base so that it would be easy to discern the city blocks. Further,
according to Griffin et al. (n.d), the highest map layer is the one that typically stands out.
Therefore, I planned to construct the walkways last and use a high contrast color to
emphasize walking access to food.
Figure 4. Drawing the Neighborhood
For me, drawing the map to scale was the most difficult part of the quilting
process. I spent days and days carefully drawing on each piece of the food environment
because I did not want to lose any of that block’s unique characteristics. This was
important if I wanted to accurately depict a true metaphor for the way in which individual
components within a neighborhood food environment can act as barriers or facilitators
to food access for the whole community.
Light gray fabric blocks were added to represent non-university owned land while
dark gray fabric blocks indicate land owned by the university. Even at this early stage,
one can see that within the campus food environment, the college students are bound
together with the local community which borders the university.
Quilt/cARTography
333
Art/Research International: A Transdisciplinary Journal
Volume 4 Issue 1, 2019
Figure 5. Piecing the Neighborhood Borders
Figure 6. Crafting the Last Layers: Student
Housing, Food Sources, Campus
Walkways
Quilt/cARTography
334
Art/Research International: A Transdisciplinary Journal
Volume 4 Issue 1, 2019
Next, I stitched blue scraps of fabric to represent the locations of student
housing, then red fabric scraps to represent food sources, and lastly, yellow fabric strips
to represent walkways to access food. As these concepts became more visually
apparent through the fabrics, a clear pattern of food access inequities began to emerge.
Figure 7. The Completed Place-Based Socio-
Spatial Quilted/cARTography of Food Access
on Campus (Ray, 2015)
Craftivism in Action: Disseminating Knowledge in the Classroom
Foundation
Data from my thesis research is interwoven into the fabric of this paper. The main
objective of my thesis research was to explore and describe the social structure of the
campus food environment. I used bricolage research designed around a multi-
methodological approach to inquiry, which included both quantitative and qualitative
Quilt/cARTography
335
Art/Research International: A Transdisciplinary Journal
Volume 4 Issue 1, 2019
methodologies (Denzin & Lincoln, 1999). Embracing the bricolage research approach
not only enabled me to construct knowledge about the structural barriers to food access
for students who lived in university housing, but also to create access to the data so that
we as a university community could draw on it to inform policy to minimize food access
inequity (Kellner, 1999). The next four sections of this paper outline the way in which
this dissemination method was incorporated into the pedagogical strategy for
undergraduate social statistics courses.
Introduction to Quilt/Research Metaphor Enrichment Activity
I used personal knowledge about the quilting process and Ausband’s (2006)
advice for novice quilters to create an enrichment activity for my social statistics
courses. During the first module, students are introduced to one of the most important
concepts in the course, the research process. Understanding the research process is
critical, because it serves as a foundation that is closely tied to most, if not all, of the
course content. I begin by hanging the quilt/cARTography on the classroom wall and by
placing a stack of worksheets and color pencils/markers on the front table. I use the
following table (see Table 1) to serve as my notes to facilitate the discussion. Within the
crafting research column, I note the corresponding content presented in the required
textbook for the course along with page numbers. This helps me to quickly locate and
reference the textbook. In my experience, students have enjoyed taking notes in
different colors and doodling in the wide margins of the worksheet. I begin the
discussion by asking if anyone in class quilts, sews, has any family members who quilt,
or if they own a quilt. The discussion evolves from there to an interactive discussion
about the similarities between quilt making and research.
Table 1. My lecture outline that I used for facilitating metaphorical thinking in the
classroom.
Quilting metaphor
Application to course content and
location of content within the
course textbook
Crafting a Quilt
Crafting a Research Study
Quilt making is an orderly process
1. The process of social research.
(Ausband, 2006) that requires the
(Frankfort-Nachmias & Leon-
crafter to carefully make a series of
Guerrero, 2018, p. 2).
choices, each of which can
significantly impact the final product
if not chosen and executed carefully.
Quilt/cARTography
336
Art/Research International: A Transdisciplinary Journal
Volume 4 Issue 1, 2019
In general, the following are quilt
making stages which each
necessitate thoughtful, deliberate
choices: identification of a reason for
creating the quilt, pattern selection,
construction method selection, skill/
knowledge building, supply
collection, quilting environment
selection, quilt construction,
dissemination, and reflection.
Note: Encourage student to touch
and look at the different quilts on the
front table of the classroom.
Reason for Making a Quilt
Purpose & Significance of
Research
The answer to the question of why a
quilter makes a quilt is parallel to
1. This includes choices such as:
why an artist researcher/instructor
identifying the problem, defining topic
might decide that a quilt is the best
and research purpose, outlining the
medium for disseminating
purpose and significance,
knowledge. I’ve never just made a
determining research methodologies
quilt for the sake of sewing. In my
(i.e., quantitative, qualitative-
experience, since creating a quilt is a
contexual, explanatory, generative,
labor of love that is both time
evaluative, ideological), and defining
consuming and expensive, most
research questions.
quilters have a reason for starting a
(Frankfort-Nachmias & Leon-
quilt project. These reasons can
Guerrero, 2018, p. 2)
range anywhere from fulfilling a basic
2. Theory
need (i.e., feeling cold and creating a
(Frankfort-Nachmias & Leon-
quilt for warmth), celebrating an
Guerrero, 2018, p. 3)
event such as a birth or wedding
3. Hypotheses
(i.e., creating a quilt as a
(Frankfort-Nachmias & Leon-
commemorative gift), or as creative
Guerrero, 2018, p. 4)
documentation (i.e., family tree quilt).
Quilt/cARTography
337
Art/Research International: A Transdisciplinary Journal
Volume 4 Issue 1, 2019
Pattern Selection
Research Design
Quilters usually select a pattern
1. Unit of analysis
based on the purpose of the quilt.
(Frankfort-Nachmias & Leon-
For example, when making a quilt for
Guerrero, 2018, p. 5)
a baby, you might select a simple
2. Variables
pattern that will withstand
(Frankfort-Nachmias & Leon-
manywashings. Or, for an older child,
Guerrero, 2018, p. 5)
perhaps you might select patterns
3. Dependent variable
based on their special interests, such
(Frankfort-Nachmias & Leon-
as trucks, cats, dolls, etc. (Ausband,
Guerrero, 2018, p. 7)
2006).
4. Independent variable research
questions
Note: Encourage students to look
(Frankfort-Nachmias & Leon-
through the quilting patterns on the
Guerrero, 2018, p. 7)
front table and ask them to choose
5. Collecting data
their favorite. Open discussion, and
(Frankfort-Nachmias & Leon-
pose a few prompts such as: Who
Guerrero, 2018, p. 8)
would the quilt likely be suitable for?
How difficult is the pattern? What
kind of tools would the quilter need?
Choice of Construction
1. Selecting appropriate methods for
conducting research (Ausband, 2006).
Hand sew or machine sew. Directly
2. Levels of measurement: Nominal
related to both is the purpose for the
variables
quilt and the intricacy of the pattern.
(Frankfort-Nachmias & Leon-Guerrero,
2018, p. 9)
3. Ordinal variables
Note: Encourage students to discuss
(Frankfort-Nachmias & Leon-Guerrero,
the possible methods of construction
2018, p. 10)
for their research and data analysis.
4. Interval-ratio variables
(Frankfort-Nachmias & Leon-Guerrero,
2018, p. 11)
5. Dichotomous variables
(Frankfort-Nachmias & Leon-Guerrero,
2018, p. 11)
6. Discrete and continuous variables
(Frankfort-Nachmias & Leon-Guerrero,
2018, p. 13)
7. Descriptive and inferential statistics
(Frankfort-Nachmias & Leon-Guerrero,
2018, p. 15)
Quilt/cARTography
338
Art/Research International: A Transdisciplinary Journal
Volume 4 Issue 1, 2019
Skill/knowledge building. The
1. Literature review
choices may require acquiring more
2. Reading textbook
information to make an educated
3. Reading code book for the
decision, for skill building to complete
secondary dataset
the process, perhaps taking a class
or reading a quilting technique book.
Collecting Supplies A quilter
1. Data collection- Researchers also
collects fabric, thread, batting
make decisions about what to collect
backing fabric, binding materials etc.
as their ‘supplies’ for conducting
…
research.
2. Population
Note: Show a quilter’s color
(Frankfort-Nachmias & Leon-
selection wheel.
Guerrero, 2018, p. 15)
3. Sample & Sampling
(Frankfort-Nachmias & Leon-
Guerrero, 2018, p. 15)
Note: show students the
measurement wheel that I used to
collect data and encourage them to
walk around the class and take
measurements.
Quilting Construction. After a
Constructing a research report
quilter knows the purpose, selects
Note: Use the department’s module
the pattern, decides how to construct
on reading and writing social
the quilt, and learns how to perform
research.
construction technique, and collects
supplies, she sews the pieces
together to form the quilt top. Then
she places batting between the quilt
top and bottom fabric. Next, she
quilts the three layers together and
secures them all with binding.
Quilt/Research Metaphor to Illustrate Variables and Levels of
Measurement: Small Group Activity
An effective pedagogical course design strategy is the incorporation of learning
objects to illustrate complex theories and foster student engagement (Signor & Moore,
Quilt/cARTography
339
Art/Research International: A Transdisciplinary Journal
Volume 4 Issue 1, 2019
2014). While reading the content of the textbook is a key component for meeting the
student learning objectives of a course, its static nature may not engage all students in
a course due to diversity in learning styles (Signor & Moore, 2014). In this context, the
quilt/cARTography method is used as a learning object to facilitate active student
engagement. This activity is a continuation of content coverage for Module One. We
build on the quilting metaphor and add the following new concepts: unit of analysis,
variables (independent, dependent, dichotomous, discrete, and continuous), causality,
spurious relationships, data collection, and levels of measurement (nominal, ordinal,
and interval-ratio). Building on the metaphorical quilt, I present the actual quilt and a
brief overview of my thesis research including purpose, significance, research
questions, hypotheses, design, and variable selection.
I save the technical details of the different data analysis techniques that I used
for later in the semester. I simply tell the students that I used findings from analysis to
craft the quilt. The student-centered lesson facilitates discussion about the module’s
concepts through a series of open-ended questions that I ask the students to answer
within their small groups. For example, I ask the small student groups to look at the quilt
and identify which variables they see represented by the map, and what level of
measurement they think I used and why (i.e., student housing locations, food source
locations, and walking distances). Then, after about 20 minutes, the small groups come
together and, as a class, we discuss the groups’ responses. This exercise introduces
the students to the real-world social issues of food access inequities and challenges
them to apply the concepts covered in their book. By actively engaging them, they have
the opportunity to build epistemic access to the discourse of social scientists by doing
social statistics instead of just memorizing term names and definitions. As an additional
bonus to reinforce what we discussed in class, students are given the opportunities for
extra credit points that will be added to Exam 1. If they choose to participate, they can
select one of many different adult coloring pages that feature quilt tops. Each has
instructions attached for coloring the individual pieces of the blocks with colors
dependent upon on the level of measurement for the variable shown inside each space.
For students that are not interested in coloring, the other option for extra credit is a
narrative reflection on quilting a conceptualization of a social topic of interest.
Quilted/cARTography Data Visualization Enrichment Activity
Within the social statistics course, the content of Module Two centers on
organizing data and data visualization methods. I supplement the quantitatively-based
lesson regarding the most commonly used methods for graphically presenting data in
social sciences (i.e., statistical map, pie chart, bar chart, histogram, line graph, time-
series chart) outlined within the course textbook. In order to create a supplementary
Quilt/cARTography
340
Art/Research International: A Transdisciplinary Journal
Volume 4 Issue 1, 2019
qualitative-based lesson, I incorporate the quilted/cARTography to open the discussion
about arts-based methods for data visualization (given it is now familiar to them). We
then watch a collection of different videos depicting different arts-based visualization
methods such as dance, music, sculpture, painted art, and fiber arts.
Craftivism in Action: Quilt/cARTography Method as a Course
Resource Tool
Regardless of the primary course delivery method (online or on-campus) I have
complemented all of my social statistics courses with an online course component on
Blackboard. I will not list all of the features of the online course component but instead
focus on one: the quilt/cARTography course resource tool. The decision to add this
resource tool was based on data from my thesis, data from course introductions, and
Thapliyal’s (2014) suggestion for the inclusion of student support services in distance
education. Thapliyal (2014) made an interesting observation when studying university
infrastructural facilities. Instructors cannot assume that just because interventions are in
place, students are aware that the student support service exists (Thapliyal, 2014). In
my experience, students are only aware of the highly publicized support services such
as Disability Support Services. However, the university provides a wide assortment of
student support services such as statistics tutoring, free SPSS software, technical
support (for SPSS and Canvas), food pantry, mobile food pantry, free counseling and
more. I carefully crafted this course resource tool page as supplementary information
for the data visualization enrichment activity. The web page includes a photo of the
completed quilt, summary of data, and resources separated into three main categories.
•Food Access Inequities and Food Insecurity Research Resources: information and
web links to local, national, and international food insecurity research organizations
and data.
•Food Insecurity Advocacy Resources: information and web links about how to
become an activist and where to volunteer.
•Food Insecurity Resources: information and web links to local organizations that
help people access food (i.e., food pantries, soup kitchens, food banks, SNAP, WIC,
etc.).
Reflections on the Implications for Crafting Pieces of Data
I wanted to understand the implications of my instructional design decision to
enact craftivism in undergraduate social statistics courses. Following Miles, Huberman,
and Saldana’s (2014) model, I analyzed students’ end of semester reflective essays and
Quilt/cARTography
341
Art/Research International: A Transdisciplinary Journal
Volume 4 Issue 1, 2019
my teaching journal and noted emerging themes. Observations and student accounts
indicate that some were affected on intellectual, physical, and emotional levels.
Academically, the quilted/cARTography engaged students to participate in
intellectual conversations about arts-based-research, data collection, and data
visualization techniques, within the content of real world social issues (such as food
access inequities on campus and overall food insecurity). One student reported that, “I
could not just zone out and stop listening since you always had a way of drawing out
attention.” Another reported that, “Using real life examples, was dope.” A third student
stated that, “It felt more natural and easier to relate to than just reading an article or
punching numbers in….definitely enhanced my learning over all.”
Not all students are compelled to physically touch the quilt, but more often than
not, at least two to three students per class touch the quilt. On several occasions,
students took selfies pointing to where they lived. Usually, when they do touch the quilt,
they locate the blue block that represents the university housing in which they live/lived
and trace with their finger the pathways they walk/walked to the red blocked access
food locations. A common pattern among students is that while their finger moved along
the quilt towards red food access locations, the students and their classmates discuss
how long the distance felt when walking, how safe they felt walking (especially at night
and during peak traffic times), and the types and cost of food that was available at a
particular location.
In one classroom presentation, a student became visibly upset when she traced
her walking route to a gas station south of campus. She pointed to where students
typically cross the street and shared that this was the location where her friend was hit
by an automobile and killed. Two other conversations following presentations of the
quilt/cARTography were emotional as well. During both of these discussions, the
student-driven conversation centered around frustrations regarding the lack of
affordable access to food on campus (in particular the c-store and meal plans) and what
should/could be done about it. I have also had students contact me privately after class
to say that they are food insecure and ask me where to get help. Both of these
interactions occurred within the first year of me presenting the quilt in the classroom.
The latter prompted me to create the student resource tool located within each course’s
online learning environment.
In response to soliciting students’ attitudes about the use of arts-based-research
visualization and dissemination methods to help them learn course material, the
following selected de-identified responses illustrate the overall pattern of student
attitudes.
Quilt/cARTography
342
Art/Research International: A Transdisciplinary Journal
Volume 4 Issue 1, 2019
I thought the arts-based research approach helped me to think about taking
statistics in a completely new manner.
Using Arts-Based Research methods throughout this course has, in my opinion,
been a beneficial tool in assisting with statistics.
I just want to say this was my first time hearing anything about art- based
research... My honest opinion about arts-based research was that I liked it! I’m a
very visual person and it actually helped me learn a little better when it came to
certain concepts in class. It definitely changed my thinking about statistics.
I am a very visual person so ABR was interesting to me because it wasn’t just
your usual numbers and equations. Sometimes the classes that were more visual
or interactive in nature I felt more relaxing and laid back…. because sometimes
all of the math we do gets monotonous… I am also very tactile as well. I like
learning with a hands on approach because I feel I retain the information better.
All in all I find Arts-Based Research very enjoyable and unique and hope to learn
more about it later.
The Magic Moment: Epistemic Access to Disciplinary Discourse
A number of students’ reflections (27 of 67) indicated that, after completing the
course, their opinions about the applicability and/or value of statistics in the real world
changed. The perceived changes most commonly fell into one of the following
categories: application in other class(es), applications within current and/or future career
path, applications as a member of society to evaluate statistics in the media, and also in
discussions with family. One student reported having a magic moment:
Now that I think about it, I remember sitting at the dinner table with my family and
explaining what exactly lambda and gamma was. How they are measures of
association and how lambda is to nominal variables as gamma is to ordinal
variables. Also tying in bivariate statistics with it as well! My parents were so
impressed and my brothers were like Thank God, I’m not in school anymore, but
that’s pretty dope. It was a magical moment. I felt so smart.
“Snags” in my Application of the Quilt/cARTography Method
Stronger community threads. As a novice researcher, who was conducting her
first major study, I did not have the forethought to include into the original Institutional
Review Board (IRB) application qualitative interviews with community participants who
viewed the quilt. This data could greatly enhance not only understanding of the social
issue, but also the way in which the method impacted the community discussions.
Therefore, I would recommend that future community-based research using a quilt/
Quilt/cARTography
343
Art/Research International: A Transdisciplinary Journal
Volume 4 Issue 1, 2019
cARTography method of dissemination include the following for IRB review: (a) semi-
structured interviews and/or questionnaire distribution to all participants who view the
quilt
(i.e., students, community members, local organizations, activists, academics at
professional conferences);
(b) within the interview/questionnaire ask the following
questions: Did the quilt invite conversations? What were the reactions of viewers? Did
viewing the quilt lead to a change in their food security status? Did viewing the quilt lead
to awareness of food insecurity? Was viewing the quilt a call to action to volunteer,
become an activist, and/or conduct food security research? Were viewers impacted by
the quilt on an emotional, intellectual, physical, and/or spiritual level? Finally, I
recommend a follow up study that includes qualitative data reflections about the
responses that a researcher receives when sharing the quilt in the community, in the
classroom, and in academic presentations. Such discussions about the potential
implications for a quilt/cARTography as a craftivism method would help produce an even
more robust study.
Stronger threads for online social statistics students. In this article, I discuss
the ways in which I used the quilt/cARTography method in face-to-face social statistics
courses. With the growth in distance learning, future research could include ways to
incorporate the method in online classes. For example, future researchers might use
technology such as Blackboard Collaborate to create interactive online activities similar
to those I used in the on campus class. Alternatively, online students could be assigned
to small groups where they participate together in a series of 2-3 discussion boards.
Then, they could collectively create a presentation for the class that would be posted to
a new discussion board that s accessible to all students.
Binding the Quilt: Finishing Thoughts
I experienced quilt/cARTography as a useful method where my researcher/self
could stitch together pieces of data to create fabric blocks within a university food
environment. Unlike disseminating data with an academic thesis that few people will
read, the quilted map (simple tactile snapshot of data) has been viewed by hundreds of
people. In addition to disseminating food access and food insecurity data within the
community, I also used this bricolage project as a creative arts-based pedagogical tool
to facilitate student’s epistemic access to knowledge construction (Denzin & Lincoln,
1999; Kellner,
1999). Arts-based methods are particularly useful when we as
researchers are trying to explore and also describe an issue within our problem-
centered research (Leavy, 2015). Arts-based methodology can be used to not only
conceptualize research, but also as a method for dissemination of data in an accessible
way in social science research (Gullion & Shaefer, 2017).
Quilt/cARTography
344
Art/Research International: A Transdisciplinary Journal
Volume 4 Issue 1, 2019
In addition to pedagogical implications of using craftivism to disseminate food
insecurity data with a quilt/cARTography, I posit that the quilt metaphor has the following
practical implications. The quilt/quilting metaphor is a valuable structurally pluralistic
pedagogical approach for connecting research design and real world issues (Koelsch,
2012). Further, when used in conjunction with the finished quilt, individuals can
experience how the piecing together of individual neighborhood blocks depicts a
snapshot in time of the campus food environment (Kellner, 1999; Sauuko, 2000).
Additionally, the quilting metaphor is useful for simplifying conversations with non-
academics about the ways in which we can build knowledge through conducting
academic research (Ausband, 2006; Sommers, 1997).
My final few finishing thoughts are similar to the final strip of fabric that a quilter
stitches around all four edges of the quilt to secure the three layers from fraying. First,
this method is accessible for all skill levels (from novice quilter/researcher to expert
quilter/researcher). Second, while I did note a few snags, they were not significant
enough to tear gaping holes that leave future researchers out in the cold. Findings from
this qualitative study support use of this method as an effective dissemination method
and pedagogical tool for use in undergraduate social statistics classrooms. Lastly, food
insecurity and food access inequities run rampant across most college and university
campuses, like an insatiable moth that slowly chews tiny holes in an old quilt which
begins to fall to pieces over time. Food access inequities can affect anyone at the
university including students, staff, adjuncts, and professors and can significantly
deteriorate not only individual educational experiences but also future opportunities. I
encourage everyone to advocate for food security policies in your community and on
your campus, because access to adequate quantities of nutritious food is not a
privilege, it is a basic human right.
Quilt/cARTography
345
Art/Research International: A Transdisciplinary Journal
Volume 4 Issue 1, 2019
Acknowledgements
I would like to thank Dr. Jessica Gullion for her helpful comments on the earlier versions
of this manuscript.
Quilt/cARTography
346
Art/Research International: A Transdisciplinary Journal
Volume 4 Issue 1, 2019
REFERENCES
Allen, R. A., Folkhard, A., Lancaster, G. A., Sherlock, C., & Abram, B. (2010). Statistics
for the biological and environmental sciences: Improving service teaching for
Ausband, L. (2006). Qualitative research and quilting: Advice for novice researchers.
The Qualitative Report, 11(4), 764-770. Retrieved from http://
Chaparro, M. P., Zaghloul, S., Holck, P., & Dobbs, J. (2009). Food insecurity prevalence
among college students at the University of Hawai'i at Mānoa. Public Health
Nutrition 12(11), 2097-2103.
Coleman-Jensen, A., Nord, M., & Singh, A. (2013). Household food security in the
United States in 2013. U.S. Department of Agriculture, Economic Research
Service (Economic Research Report. ERR-155.) Retrieved from http://
Denzin, N. K., & Lincoln, Y. S. (Eds.). (1999). The SAGE handbook of qualitative
research (3rd ed.). Thousand Oaks, CA: Sage Publications.
Dubick, J., Mathews, B., & Cady, C. (2016). Hunger on campus: The challenge of food
insecurity for college students (Research Report). Retrieved from http://
Eisenmann, J. C., Gundersen, C., Lohman, B. J. Garasky, S., & Stewart, S. D. (2011).
"Is food insecurity related to overweight and obesity in children and
adolescents? A summary of studies, 1995-2009. Obesity Reviews 12(1):
73-83.
Elliot, H., Ryan, J., & Hollway, W. (2012). Research encounters, reflexivity and
supervision. International Journal of Social Research Methodology, 15(5),
433-444. doi:10.1080/13645579.2011.610157
Frankfort-Nachmias, C., & Leon-Guerrero, A. (2018). Social statistics for a diverse
society (8th ed.). Thousand Oaks, CA: Sage.
Quilt/cARTography
347
Art/Research International: A Transdisciplinary Journal
Volume 4 Issue 1, 2019
Gallegos, D., Ramsey, R., & Ong, K. (2014). Food insecurity: Is it an issue among
tertiary students? Higher Education 67(5): 497-510.
Griffin, A., Gruver A., Dutton J. A., College of Earth and Mineral Sciences, & The
Pennsylvania State University. (n.d.). GEOG 486: Cartography and
visualization [Courseware module] Penn State’s College of Earth and Mineral
Gullion, J. S., & Shaefer, L. (2017). Arts-based research in sociology, anthropology, and
psychology. In P. Leavy (Ed.), The handbook of arts-based research (Chapter
27). New York, NY: Guilford Press.
Kellner, D. (1999). Theorizing McDonaldization: A multiperspectivist approach. In B.
Smart (Ed.), Resisting McDonaldization (pp. 186-206). London, UK: Sage.
Koelsch, L. E. (2012). The virtual patchwork quilt: A qualitative feminist research
method. Qualitative Inquiry, 18(10), 823-829. doi:10.1177/1077800412456957
Leavy, P. (2015). Method meets art: Arts-based research practice (2nd ed.). New York,
NY: The Guilford Press.
Lynch, H. L., & Fisher-Ari, T. R. (2017). Metaphor as pedagogy in teacher education.
Teaching & Teacher Education, 66, 195-203.
Maroto, M. (2013). Food insecurity among community college students: Prevalence and
relationship to GPA, energy, and concentration (Doctoral dissertation, Morgan
McMillan, E. (2016). Food insecurity touches 38% of Acadia students, survey finds.
Miles, M. B., Huberman, A. M., & Saldana, J. (2014). Qualitative data analysis: A
methods sourcebook (3rd ed.). Thousand Oaks, CA: Sage.
Quilt/cARTography
348
Art/Research International: A Transdisciplinary Journal
Volume 4 Issue 1, 2019
Mol, A. (2002). The body multiple: Ontology in medical practice. Durham, NC: Duke
University Press.
Mouraz, A., Pereira, A. V., & Monteiro, R. (2013). The use of metaphors in the process
of teaching and learning in higher education. International Online Journal of
Educational Sciences, 5(1), 99-110.
Navaneedhan, C. G. (2017). Skill based teaching: Learning science implementing
metaphorical thinking. Journal of Computers in Mathematics & Science
Teaching, 36(4), 351-360. doi:10.13140/RG.2.1.2635.4089
Orszag, J. M., Orszag, P. R., & Whitmore, D. M. (2001). Learning and earning: Working
Patton-López, M., Daniel, M., López-Cevallos, F., Cancel-Tirado, D. I., & Vazquez, L.
(2014). Prevalence and correlates of food insecurity among students
attending a midsize rural university in Oregon. Journal of Nutrition Education
& Behavior 46(3), 209-214.
Ray, A. (2015). Food access on campus: A place based socio-spatial method to
measure structural barriers within the campus food environment (Master’s
Saukko, P. (2000). Between voice and discourse: Quilting interviews on anorexia.
Qualitative Inquiry, 6, 229-317.
Savin-Baden, M., & Major, C. H. (2013). Qualitative research: The essential guide to
theory and practice. New York, NY: Routledge.
Signor, L., & Moore, C. (2014). Open access in higher education: Strategies for
engaging diverse student cohorts. Open Praxis, 6(3), 305-313.
Sommers, R. C. (1997). The quilting bee: A research metaphor. The Qualitative Report,
Stipek, D. (2006). Relationships matter. Educational Leadership, 64(1), 46-49.
Quilt/cARTography
349
Art/Research International: A Transdisciplinary Journal
Volume 4 Issue 1, 2019
Thapliyal, U. (2014). Perceived quality dimensions in distance education: Excerpts
fromstudent experiences. Turkish Online Journal of Distance Education,
15(3), 60-67.
Walker, S., Read, S., & Priest, H. M. (2013). Use of reflexivity in a mixed-methods study.
Nurse Researcher, 20(3), 38-43.
Waples, J. A. (2016). Teacher-ready research review: Building emotional rapport with
students in statistics courses. Scholarship of Teaching and Learning in
Psychology, 2(4), 285-293.
Zaenker, J., & Vladis, N. (2017). Feel the heat - A world temperature data quilt. [Quilted
climate map]. University of Edinburgh. EDINA.
Quilt/cARTography
350