Research Article
Finding Your Place: Assessing Diversity, Equity, and
Inclusion in an Academic Library
Khaleedah Thomas
Copyright & Scholarly
Communications Librarian
Colorado State University
Libraries
Fort Collins, Colorado,
United States of America
Email: khaleedah.thomas@colostate.edu
Meggan Houlihan
Director of Open Society
University Network’s Library Resources Program
Open Society University
Network, Central European University
Vienna, Austria
Email: mhoulihan@bard.edu
Received: 27 May 2024 Accepted: 8 Oct. 2024
![]() 2025 Thomas and Houlihan. This is an Open Access article
distributed under the terms of the Creative Commons‐Attribution‐Noncommercial‐Share Alike License 4.0
International (http://creativecommons.org/licenses/by-nc-sa/4.0/),
which permits unrestricted use, distribution, and reproduction in any medium,
provided the original work is properly attributed, not used for commercial
purposes, and, if transformed, the resulting work is redistributed under the
same or similar license to this one.
2025 Thomas and Houlihan. This is an Open Access article
distributed under the terms of the Creative Commons‐Attribution‐Noncommercial‐Share Alike License 4.0
International (http://creativecommons.org/licenses/by-nc-sa/4.0/),
which permits unrestricted use, distribution, and reproduction in any medium,
provided the original work is properly attributed, not used for commercial
purposes, and, if transformed, the resulting work is redistributed under the
same or similar license to this one.
DOI: 10.18438/eblip30569
Abstract
Objective
– An exploratory study was conducted to identify the
key factors that influence students’ perceptions of a sense of belonging in an
academic library, focusing particularly on gaining insight into the perspectives
of students from historically marginalized communities.
Methods – Participants
were administered an online survey comprising 18 multiple-choice, Likert-type,
and open-ended questions. The survey was active for three weeks during March
and April 2022. Effect sizes were calculated using Pearson point-biserial
correlation statistics. Qualitative results were coded using thematic analysis.
Results
– An analysis of the quantitative data revealed that
students who identified as non-binary/queer/gender non-conforming, identified
as a person of color, or identified as a person with a disability were less
likely to find the library as inclusive. They were also more likely to report
incidents of microaggression, bias, or discrimination. An analysis of the
qualitative data revealed several key factors influencing perceptions of
inclusiveness, including space, collections, displays, art, technology,
programming, marketing, staff, and wayfinding.
Conclusion – These mixed findings suggest that while the majority of students
perceive the library environment as inclusive, further efforts are needed to
establish a truly inclusive and safe space for students from historically
marginalized communities.
Introduction
The climate of
universities can significantly impact the retention and graduation rates of
students of color, particularly those from underrepresented and marginalized
communities (Silver Wolf (Adelvunegv Waya) et al., 2017). When faced with a toxic campus culture
that perpetuates harmful stereotypes, students with marginalized identities
often question their social belonging as repeated experiences of
microaggressions can negatively influence their perceptions of the campus as
hostile, signifying that they have no place in the university space (Sanchez,
2019; Walton & Cohen, 2011). As vital components of institutions of higher
education, academic libraries are not immune from perpetuating systems of
oppression, despite the myth of the library as a neutral space (Gibson et al.,
2017). To effect real change, academic libraries must understand how they
contribute to upholding these structural and institutional systems of
inequality (Gibson et al., 2020). The first step in this process is engaging in
critical assessment to identify the biases and limitations embedded within the
library’s services and spaces.
Colorado State
University Libraries (CSUL) embraces the land grant mission of the university
and its commitment to the foundational principle of inclusive excellence, the
idea that institutional success can only be achieved if the institution
welcomes, values, and affirms all members of the CSU community (Colorado State
University Libraries, 2021). Guided by this mission and CSU Principles of
Community, which include inclusion, integrity, respect, service, and social
justice, CSUL strives to foster a welcoming environment for the over 25,000
students, employees, and the larger CSU community that regularly visit one of
its two locations, Morgan Library, and the Veterinary Teaching Hospital Library
(Institutional Research, Planning, and Effectiveness, 2023). As the hub for
academic success and interdisciplinary collaboration on campus, CSUL partners
with individuals on their academic journey and strives for excellence in
research, creative artistry, and scholarship. With strategic goals to boost
equitable access to knowledge and align library services and spaces with user
needs, CSUL is intentional in engaging in efforts that place diversity, equity,
and inclusion (DEI) at the forefront of its priorities (Colorado State
University Libraries, 2021). In spring 2022, a survey was conducted to gain
insight into students’ perceptions of DEI in the library. This study analyzes
survey results to critically assess CSUL's effectiveness in fostering a
welcoming environment for all.
Literature Review
Fostering a Sense of Belonging
A fundamental
human need is to experience social belonging and a sense of cultivating
positive relationships with others (Walton & Cohen, 2011). Mahar et al.
(2013) identified five interconnected themes that conceptualize a sense of
belonging: subjectivity, groundedness to an external
referent, reciprocity, dynamism, and self-determination. Applying these five
themes to a library context, Scoulas (2021) conducted
research to measure university students’ sense of belonging and inclusion at
the University of Illinois Chicago Libraries during the COVID-19 pandemic. In
this study, a sense of belonging was defined as students’ perceptions of
feeling valued and respected by librarians, as well as feeling accepted through
their access and use of library spaces and collections. The study found that
students who primarily used the physical library reported a stronger sense of
belonging compared to those who relied solely on online library resources. This
finding implies a significant link between personal interactions with the
physical library and fostering a greater sense of belonging among students.
Similar findings were observed in research exploring the experiences of
first-generation students in academic libraries. These students reported that
their use of the library space was directly influenced by how welcomed and
respected they felt within that environment, especially when the space valued
all their intersecting identities (Couture et al., 2021).
Racial Climate and Cultural Recognition
Identifying
the factors that contribute to fostering a sense of belonging is the first step
in creating an inclusive environment. While there is still a dearth of research
in this area, a few studies elucidate the factors that influence a sense of
belonging in various demographic groups within library settings, particularly
for those who hold identities from marginalized communities, such as racially
minoritized students. One study highlights the importance of creating inclusive
spaces within an academic library. Research conducted at Duke University
Libraries (DUL) revealed that overall, Black students perceived DUL as an
inclusive space that met their diverse learning needs as underrepresented
students in a predominantly White institution (Chapman et al., 2020). However, upon closer examination, researchers
found that Black students also faced negative interactions with both staff and
peers at DUL. They perceived certain aspects of the library spaces as
unwelcoming, often due to the dominant focus on White history. Among the issues
raised were the lack of visible support for diversity and inclusion, minimal
efforts to limit White western cultural dominance, and the absence of
initiatives to educate White students about the experiences of minoritized
communities.
Given the history of anti-Blackness in libraries, it
is imperative for libraries to move beyond symbolic gestures and actively
address the entrenched anti-Black structures and behaviors to foster a truly
equitable environment for Black employees and patrons (Ossom-Williamson
et al., 2021). Research conducted by Stewart et al. (2019) shed light on the
significance of racial climate and its impact on fostering inclusiveness in
academic libraries. Using a crowdsourced convenience sampling method,
researchers administered a national online survey to 160 Black college students
attending non-historically Black colleges and universities in the United
States. This study explored the key factors influencing Black college students’
perceptions of welcomeness in academic libraries. Most respondents reported
feeling welcomed in these libraries, with the social climate of the space and
information access being the most significant factors contributing to
perceptions of welcomeness. Interestingly, it was not the interactions with
library staff that made a significant difference but rather the behavior of
other library users that had the greatest impact. Researchers surmised that the
lack of influence from library employees was most likely due to infrequent
communication with staff or the standardized, professional nature of library
services. In contrast, interactions with the library as a physical space
significantly impacted students' sense of welcomeness primarily due to the
behavior of other patrons. This finding underscores the idea that libraries are
more than just architectural structures; they are cultural spaces where social
dynamics, particularly microaggressions from others, critically influence the
experiences of Black students.
Furthermore, students' perceptions of the overall
racial climate on campus also affected how welcoming they found the library. If
students perceived the broader campus environment as hostile or racist, they
were more likely to view the library as less welcoming. This suggests that
libraries are intrinsically connected to the broader campus community and need
to work in tandem with their institutions to foster a genuinely welcoming
environment (Stewart et al., 2019).
Representation and cultural recognition are
significant factors in cultivating a sense of belonging among marginalized
groups within library settings. Research conducted at the University of Nevada,
Reno Libraries examined the library experiences, needs, and perceptions of
undergraduate Native American students (Bucy, 2022). Researchers found that
Native students’ perceptions of a sense of belonging were closely linked to the
extent to which their Native identity was reflected on campus, with
distinctions drawn between “White spaces” and “Native spaces”. Similarly,
Native students valued visible representations of Native American culture in
the library through exhibits, displays, and collections. This finding suggests
that incorporating visible representations of marginalized identities in
library spaces can foster a sense of belonging by offering positive cultural
recognition, provided that the representation is respectful and culturally
relevant.
Building Inclusive Spaces for LGBTQ+ Community
Creating a safe space plays a pivotal role in
fostering a sense of belonging, particularly for individuals within the
lesbian, gay, bisexual, transgender, queer, and questioning (LGBTQ+) community
who are at greater risk of experiencing harassment, discrimination, and
violence compared to the broader population (Dau & Strauss, 2016). This is
especially true for individuals who identify as transgender or non-binary, and
who may need specific accommodations such as specific facilities, equipment, or
resources to meet their needs (Matheson et al., 2020). Research conducted by
Drake and Bielefield, (2017) explores the unique
accommodations essential to welcoming transgender patrons into the library.
Using convenience snowball sampling, researchers surveyed 102 individuals
through an online questionnaire. Analyses revealed the following top five accommodations
to create a safe environment within the library:
1.
Updating LGBTQ+ literature within the
collection.
2.
Providing gender-neutral single-stall
restroom access without requiring a key for entry.
3.
Implementing a non-discrimination policy
that affirms gender identity and expression.
4.
Establishing a procedure enabling
patrons to change their names remotely (e.g., online, fax or by mail).
5.
Adapting library forms by eliminating
gender markers, titles or salutations or offering alternatives for
self-identification.
Understanding how LGBTQ+ students’ information and
spatial needs may differ from the general population is the first step in removing
barriers to creating a more inclusive environment in libraries (Hays, 2020; Lyttan & Laloo, 2020).
Holistic Approaches to Accessible Spaces
Another key factor that can contribute to fostering
a sense of belonging is creating accessible spaces within a library to
accommodate the needs of students with disabilities. Research conducted at the
University of Kuala Lumpur demonstrated how to effectively foster a sense of
belonging among students with disabilities (Bodaghi
& Zainab, 2013). The university’s library provided 53 study carrels for
student use, with 21 reserved for visually impaired students. Researchers
conducted interviews and focus groups with 18 visually impaired students who
regularly used these carrels and found that they significantly influenced their
sense of belonging within the library. Most participants perceived the study
carrels as a second home, where they felt safe, solace, and accepted as active
members of the library community. Moreover, the study carrels also functioned
as a social hub for visually impaired students, enabling them to interact with
peers and ultimately enhancing their overall academic experiences.
Creating genuinely inclusive library spaces requires
more than just compliance with Americans with Disabilities (ADA) standards.
Learning from the insightful experiences of authors who designed new study
spaces and a conference room at Library Services, Minnesota State University,
Mankato, underscores the need for libraries to delve deeper into understanding
disability dimensions beyond basic legal requirements (Schomberg & Corley,
2022). Despite the technical ADA compliance, the use of the space revealed
shortcomings such as inadequate maneuverability for wheelchair users,
non-automatic doors, and lack of planned space for height-adjustable tables. To
prevent future oversights, the authors recommend that future library space
planning adopt a broader understanding of disability, integrate the latest
research, and actively involve disabled individuals and advocates in the
planning process.
Aims
This paper adds to the growing body of research that
explores DEI in library spaces. Given the mission of CSUL and the multitude of
factors that may influence feelings of inclusion, we sought to measure factors
that influence a sense of belonging in undergraduate students in an academic
library.
The study was guided by the following research
questions:
1.
Are students from historically
marginalized communities less likely to perceive the library as an inclusive
environment?
2.
What factors influence students’
perceptions of what constitutes an inclusive environment in the library?
This paper holds significance to other academic
libraries interested in assessing DEI within their own library spaces.
Methods
Participants and Design
Students attending Colorado State University were
invited to participate in an online survey. The survey was active for three
weeks, from March 14, 2022, to April 4, 2022. The primary promotional
strategies included digitally disseminating flyers and posters around campus
and including a banner advertising the study on the library website.
Participants were also recruited via targeted emails to select groups such as
the student affinity groups, the Associated Students of Colorado State
University electronic mailing lists, and through tabling efforts in the lobby
of Morgan Library. Upon completing the survey, participants could elect to
enter a random drawing to win one of twenty $50 Amazon gift cards. The Colorado
State University Institutional Review Board (IRB-2904) approved the survey,
marketing materials, and incentives on December 14, 2021.
Survey
We developed an online survey consisting of 18
questions, using Qualtrics, a web-based survey platform. The survey questions
were designed taking inspiration from various sources, including Harvard
University’s Inclusive Demographic Data Collection Tip Sheet (Office of
Regulatory Affairs and Research Compliance, 2020), CSU’s Employee Climate
Survey (Colorado State University Office for Inclusive Excellence, 2021), and
the Poudre River Public Library District’s survey on equity, diversity, and
inclusion (2021). While the questions were not piloted prior to distribution,
they were refined through multiple rounds of review by colleagues. The survey
included multiple-choice items, Likert-type items, and open-ended questions.
The demographic information collected in this survey included age, educational
standing, gender, race/ethnicity, sexual orientation, first-generation status,
and disability status.
In addition to gathering demographic information,
the survey was organized into sections focusing on library services and an
inclusive environment. To assess library services, we asked questions designed
to measure how often students visited the library, their frequency of usage of
library services, and their ratings of the helpfulness of those services. To
evaluate an inclusive environment, the survey included questions to gauge
students’ perceptions of belonging, the frequency of experiencing
microaggressions, bias, or discrimination, as well as their feelings of safety
and representation. Additionally, three open-ended questions invited feedback
on how the Morgan Library could better represent diverse identities and create
a more inclusive, welcoming space. The full survey is included in the Appendix.
Analyses
Quantitative
Data were analyzed using R and the base stats
package. R was also used for data cleaning and to construct data frames needed
to conduct analyses. Survey item scores were converted to numerical values (for
example, disagree = 1, somewhat disagree = 2, neutral = 3, somewhat agree = 4,
agree = 5). Pearson point-biserial correlational analysis was used for
inferential testing and to determine the strength of association between
participant identities and item responses. Inferential tests were two-sided
with alpha set to 0.05. The effect size was interpreted as small (|r| ≥ .1
& < .3), medium (|r| ≥ .3 & < .5), or large medium (|r| ≥ .5)
(Cohen, 1988).
Groups were collapsed to improve sample size and
interpretation. To examine gender, we compared participants who identified as
non-binary/genderqueer/gender non-conforming to participants who identified as
cisgender men or women (n = 47 vs. 555). To examine race/ethnicity, we compared
participants who identified as BIPOC (Black, Indigenous, Person of Color) to
participants who only identified as White (n = 240 vs. 362). To examine sexual
orientation, we compared participants who identified as lesbian, gay, bisexual,
transgender, queer, and asexual (LGBTQ+) to participants who identified as
straight/heterosexual (n = 248 vs. 354). To examine disability status, we
compared participants who identified as a person with a disability to those who
did not (n = 81 vs. 521). These binary
classifications were then converted to 1 vs. 0 quantitative codes for the
purpose of running correlation analyses. Quantitative coding of demographic
variables is common practice in statistical analyses, including correlation and
regression (Cohen et al., 2002). Recommendations for analyzing variables such
as race explicitly advocate creating dichotomous variables (Ross et al., 2020).
Qualitative
Both authors were responsible for coding the
open-ended responses. We took an inductive approach to the coding process by
allowing themes and codes to emerge from the data. We collaboratively created a
codebook that included definitions of codes that were applied to the dataset.
We conducted three rounds of coding, where we coded the open-ended responses individually
and compared the results. All instances of disagreement were thoroughly
discussed and reevaluated until a consensus was reached. After the second round
of coding, there were few instances of disagreement, likely due to the
simplicity of responses and a clear understanding of our dataset. NVivo, a
qualitative analysis tool, was used for analysis. Three questions were
analyzed:
1.
How can we represent your identity
better in Morgan Library spaces?
2.
What services do you believe Morgan
Library can add to become a more inclusive and welcoming space?,
and
3.
Is there anything else you would like to
tell us about Morgan Library?
Results
Participant Demographics
The survey received responses from 621 participants;
however, 19 participants did not respond to any questions asked about the
library and were therefore excluded from all analyses resulting in a total
sample size of 602 respondents. Additionally, participants were not required to
answer every question and could respond as they deemed appropriate. Descriptive
and inferential analyses are reported with respect to the total number of
respondents.
When reporting total numbers and percentages of
demographic variables, we allowed participants to select more than one
response. Percentages are, therefore, always relative to the total number of
responses, and categories within the same item are not mutually exclusive.
The data indicated that 89% (n = 533 out of 600
total responses) of participants were between the ages of 18-24, and 91% (n =
539 out of 590 total responses) of participants identified their educational
standing as undergraduate students, with the remaining 51 self-identifying as
graduate students. Additionally, 28% (n = 165 out of 591 total responses)
identified themselves as first-generation college students, and 14% (n = 81 out
of 592 total responses) of participants self-identified as persons with a
disability.
Participants were asked to identify their gender and
had the option to select more than one option or abstain from responding. The
total response rate to the items in this question was 592 responses. The data
indicated that 60% (n = 354) of participants identified themselves as women,
32% (n = 192) as men, 8% (n = 47) as non-binary/genderqueer/gender
non-conforming, 7% (n = 40) as cisgender, 2% (n = 10) as trans/transgender, 1%
(n = 4) as agender. One percent (n = 4) preferred to self-describe their
gender, 1% (n = 4) preferred not to disclose their gender, and less than 1% (n
= 2) self-identified as two-spirit.
Participants were asked to identify their
race/ethnicity and had the option to select more than one option or abstain
from responding. The total response rate to the items in this question was 591
responses. The data indicated that 71% (n = 420) self-identified as White, 20%
(n = 121) as Latina, Latinx, or Latino, 8% (n = 45) as Asian (including East
Asian, South Asian, or Southeast Asian), 5% (n = 32) as Black or African
American, 3% (n = 15) as Indigenous, First Nations, American Indian, or Alaskan
Native, 2% (n = 10) as Arab, Persian, or other peoples of the Middle East, and
1% (n = 3) self-identified as Native Hawaiian or other Pacific Islander.
Participants were asked to identify their sexual
orientation and had the option to select more than one option or abstain from
responding. The total response rate to the items in this question was 590. The
data indicated that 61% (n = 361) of participants self-identified as
straight/heterosexual, 20% (n = 116) as bisexual, 9% (n = 51) as queer, 8% (n =
45) as gay or lesbian. Four percent of respondents (n = 22) preferred not to
disclose their sexual orientation, 3% (n = 17) self-identified as asexual, and
2% (n = 13) preferred to self-describe their sexual orientation (e.g.,
demisexual or pansexual).
Quantitative Results
Ratings of Sense of Belonging
Students were asked to report their level of
agreement with a series of statements used to measure their perception of a
sense of belonging. The results revealed that 79% (n = 477) of respondents
either somewhat or strongly agreed that the library is an inclusive space,
compared to 8% (n = 47) who somewhat or strongly disagreed. Additionally, 85%
(n = 511) agreed that Morgan Library is welcoming, compared to 6% (n = 34) who
somewhat or strongly disagreed. Regarding comfort using library services, 82%
(n = 491) somewhat or strongly agreed with this statement, compared to 6% (n =
34) who somewhat or strongly disagreed. Lastly, 75% (n = 453) somewhat or
strongly agreed that they felt comfortable asking for help, compared to 10% (n
= 62) who somewhat or strongly disagreed.
Ratings of Frequency of Microaggressions, Bias, or Discrimination
Students were asked to report how frequently they encountered
microaggressions, bias, or discrimination in the library. The results showed
that 65% (n = 393) of respondents reported never experiencing such incidents at
Morgan Library. Following this, 25% (n = 150) reported rarely encountering
microaggressions, bias, or discrimination. Only 2% (n = 12) reported
experiencing these issues during every visit, while 1% (n = 5) experienced them
every other visit, and less than 1% (n = 5) reported daily occurrences.
Ratings of Safety
Students were asked several questions to measure
their sense of safety in the library. The data revealed that 83% (n = 499)
somewhat or strongly agreed that they felt safe from physical harm,
discrimination, or emotional harm in the library, while 5% (n = 33) somewhat or
strongly disagreed. When questioned about feeling safe reporting
microaggressions, bias, and discrimination to library staff, 67% (n = 405)
somewhat or strongly agreed, whereas 8% (n = 47) somewhat or strongly
disagreed. Regarding the library's efforts to minimize microaggressions, bias,
and discrimination, the largest group—47% (n = 264)—neither agreed nor
disagreed, 25% (n = 150) somewhat or strongly agreed, and 24% (n = 143)
disagreed with this statement.
Ratings of Representation
Students were asked a series of questions to measure
how much they believed the library space represented and reflected their
identities. The results showed that 57% (n = 341) somewhat or strongly agreed
that they felt represented in the library, while 10% (n = 61) somewhat or
strongly disagreed. When asked if the library’s resources consider different
identities, 63% (n = 380) somewhat or strongly agreed, compared to 6% (n = 37)
who somewhat or strongly disagreed. Lastly, 70% (n = 419) somewhat or strongly
agreed that the library showcases the work of diverse identities throughout its
spaces, while 5% (n = 33) somewhat or strongly disagreed.
Comparisons of Ratings by Gender Identity
An analysis of gender identity revealed that,
compared to participants who identified as cisgender men or women, participants
who identified as non-binary/genderqueer/gender non-conforming were
significantly less likely to view the library as an inclusive space (r = -0.11,
p = 0.006) or welcoming (r = -0.13, p = 0.001). They were also significantly
more likely to report experiencing microaggression, bias, or discrimination (r
= 0.18, p < 0.001), and were significantly less likely to report feeling
safe from physical harm, discrimination, or emotional harm (r = -0.13, p =
0.002) and feeling safe to report microaggression, bias, or discrimination to
library staff (r = -0.15, p = 0.003). Participants were also less likely to
report feeling represented in Morgan Library (r = -0.09, p = 0.026). These
effects are displayed in Figure 1 as correlations.
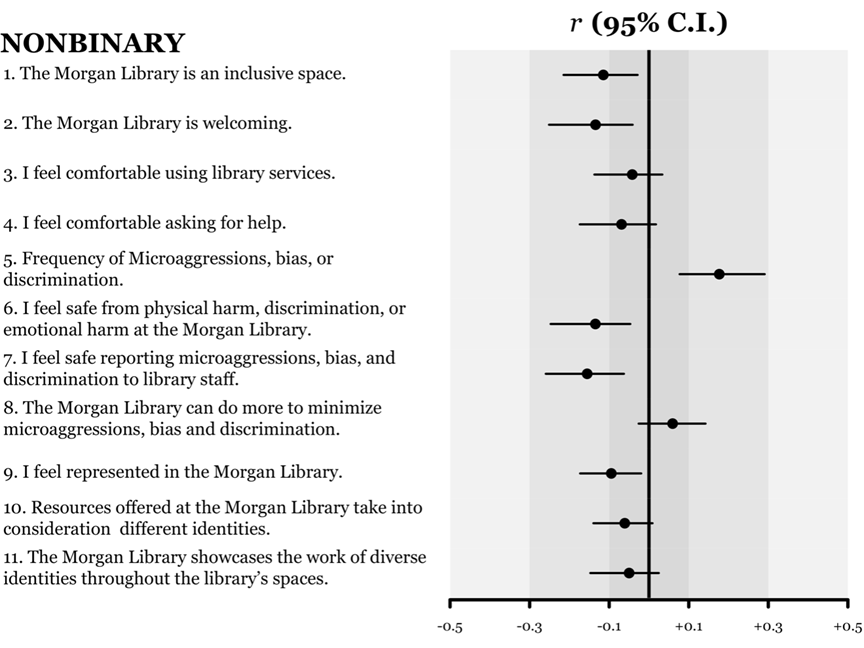
Figure 1
Correlations between nonbinary identity and item
ratings. Correlations range between -1 and 1, with negative values indicating a
negative association, positive values indicating a positive association, and
values closer to 0 indicating no association. The vertical line down the center
indicates a 0 correlation. The circles with confidence bars represent the
estimates. Estimates to the left are negative correlations and estimates to the
right are positive correlations.
Comparisons of Ratings by Race/Ethnicity
An analysis of race/ethnicity revealed that compared
to participants who identified as White, participants who identified as BIPOC
(Black, Indigenous, People of Color) were significantly less likely to feel
safe reporting microaggression, bias, or discrimination to library staff (r =
-0.10, p = 0.022). They were also significantly less likely to report feeling
represented in Morgan Library (r = -0.24, p < 0.001), to feel resources
offered at Morgan Library considered different identities (r = -0.13, p = 0.003),
and to feel that Morgan Library highlights the work of diverse identities
throughout its spaces (r = -0.13, p = 0.003). These effects are displayed in
Figure 2 as correlations.
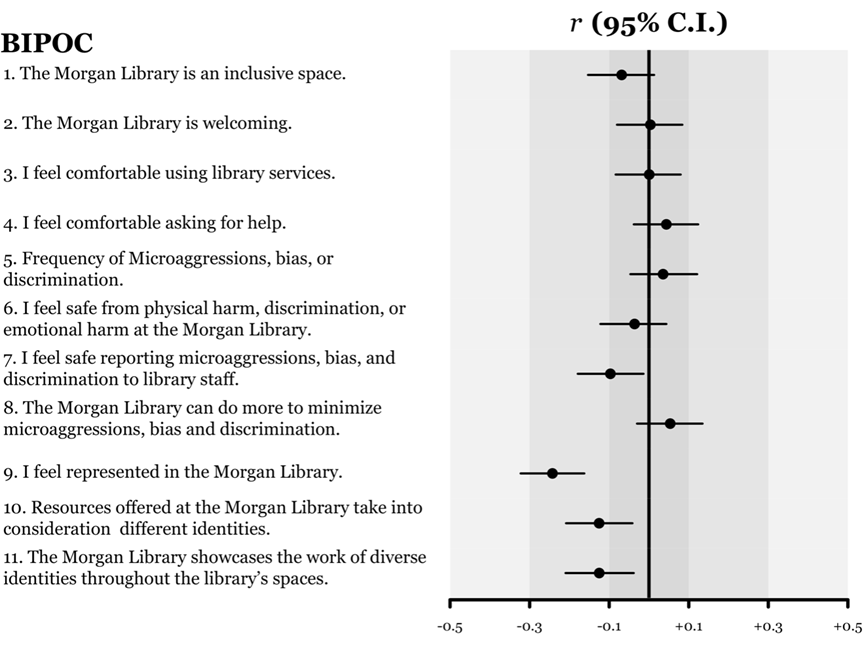
Figure 2
Correlations between BIPOC identity and item
ratings. Correlations range between -1 and 1, with negative values indicating a
negative association, positive values indicating a positive association, and
values closer to 0 indicating no association. The vertical line down the center
indicates a 0 correlation. The circles with confidence bars represent the
estimates. Estimates to the left are negative correlations and estimates to the
right are positive correlations.
Comparisons of Ratings by Sexual Orientation
An analysis of sexual orientation revealed that compared
to participants who identified as straight/heterosexual, participants who
identified as LGBTQ+ were significantly more likely to report experiencing
microaggressions, bias, or discrimination (r = 0.15, p < 0.001). These
effects are displayed in Figure 3 as correlations.
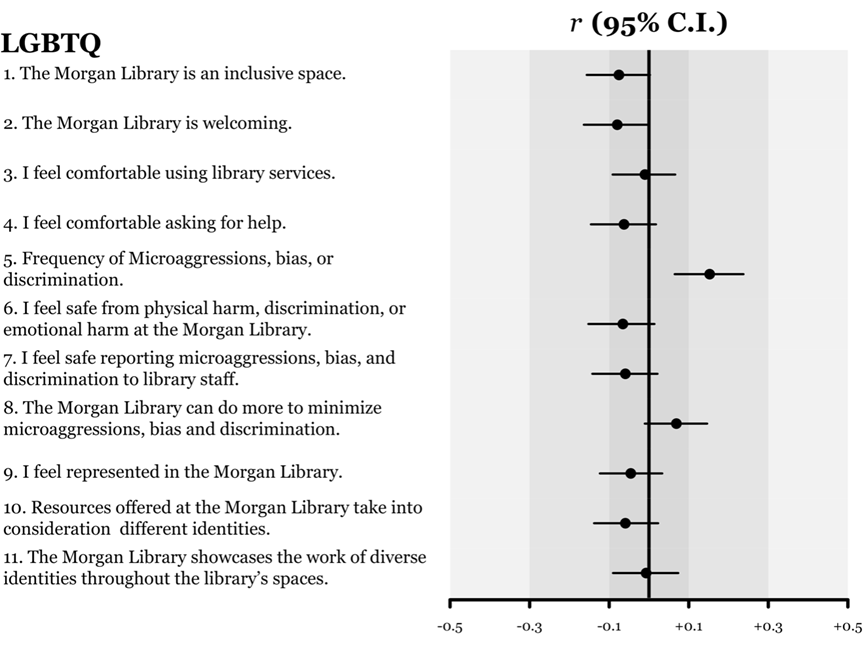
Figure 3
Correlations between LGTBQ identity and item
ratings. Correlations range between -1 and 1, with negative values indicating a
negative association, positive values indicating a positive association, and
values closer to 0 indicating no association. The vertical line down the center
indicates a 0 correlation. The circles with confidence bars represent the
estimates. Estimates to the left are negative correlations and estimates to the
right are positive correlations.
Comparisons of Ratings by Disability Status
An analysis of disability status revealed that,
compared to participants who identified as able-bodied, participants who
identified as disabled were significantly less likely to view the library as an
inclusive space (r = -0.11, p = 0.013), welcoming (r = -0.11, p = 0.008), or to
feel comfortable asking for help (r = -0.09, p = 0.038). They were also
significantly more likely to report experiencing microaggression, bias, or
discrimination (r = 0.21, p < 0.001), were less likely to feel safe from
physical harm, discrimination, or emotional harm (r = -0.18, p < 0.001), and
to feel safe to report microaggression, bias, or discrimination to library
staff (r = -0.18, p < 0.001). Participants who identified as disabled were
also significantly less likely to report feeling represented in Morgan Library
(r = -0.09, p = 0.04) and to report that Morgan Library highlights the work of
diverse identities throughout its spaces (r = -0.09, p = 0.030). These effects
are displayed in Figure 4 as correlations.
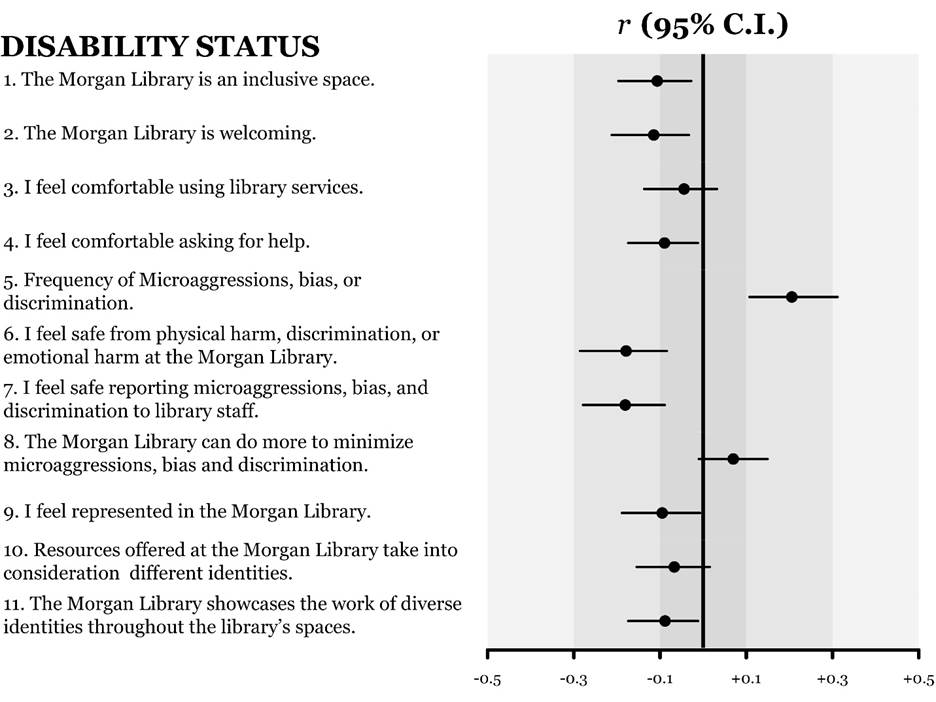
Figure 4
Correlations between disability status and item
ratings. Correlations range between -1 and 1, with negative values indicating a
negative association, positive values indicating a positive association, and
values closer to 0 indicating no association. The vertical line down the center
indicates a 0 correlation. The circles with confidence bars represent the
estimates. Estimates to the left are negative correlations and estimates to the
right are positive correlations.
Qualitative Results
We received 180 responses to the question, "How
can we represent your identity better in Morgan Library spaces?" All
comments were coded when applicable. There were instances where the comments
were not comprehensible or offensive. In these cases, the comments were not
coded. The top five codes were: “Space,” “Collections,” “Displays,” “Art,” and
“Programming.”
The top code applied to this question was “Space” (n
= 37), which included all comments related to the physical spaces within Morgan
Library. Students provided many responses to this question ranging from the
need for more silent study spaces to the need for more accessible library
entrances. One student offered insight on inclusive spaces, “I think it might
be nice to offer some space hours specifically for people with disabilities.
For example, I have ADHD and I have sensory problems and it would be nice to
maybe have separate sign up for study rooms.” Several comments related to
access to gender-neutral bathrooms, as one student stated, “More clearly marked
gender neutral bathrooms...I know this is a structural issue, but gender
inclusive restrooms should be more common throughout.”
Responses coded with “Collections” (n = 35) included
all mentions of physical or electronic collections. One student said,
“Honestly, I feel represented by seeing books about my culture but also books
or posters showing other cultures as well.” Another student commented, “(The)
history section is Whitewashed.” A student also suggested that the library,
“Display books by and about queer issues topics/general fiction focusing on
special identities...” Several students called for additional books in specific
areas such as, “More disabled and/or Jewish books” and “International books in
(the) most popular foreign languages.”
All mentions of physical displays within the library
were coded with “Displays” (n = 23). One student suggested, “Shelves displaying
authors with different identities around the library.” Another student
commented that, “It is Women's History month this month, so maybe having a
display about that would be cool.” Finally, a student suggested, “I think it
would be cool to have more library displays curated by some of the cultural
centers on campus or Pride Resources Center, etc., to let students, with mediation,
display their identities at the library.”
The code “Art” (n = 16) was used to indicate any
mention of prints, photographs, or paintings displayed on the walls of Morgan
Library. A student stated, “I would appreciate more visibility of LGBT+
inclusion, such as the display of the Philadelphia pride flag and others, as
well as posters for LGBT resources.” Another student suggested, “I think seeing
the historical art of different ethnicities could help represent identity
better.” Finally, one student suggested “More Latino artwork.”
Codes related to “Programming” (n = 16) were applied
at all mentions of events and workshops held within the library. One student
commented, “Include more local contributions, as well as contributions from
minorities as well as featuring and promoting these folks more often.
Potentially hold events like book club readings, discussions, etc.” Another
student said, “I think that hosting more diverse events and notifying students
by email of these upcoming events would help increase the engagement and
representation here at the Morgan Library.” Finally, one student suggested,
“Maybe partner with the diversity centers on campus to offer DEI events to help
support inclusive efforts.”
Additional topics included “Staff” (n = 8), which
comprised all mentions of staff, staff training, or more inclusive customer
service practices. For example, one student said, “As a trans woman who has not
transitioned in a legal way, having to present my ID when checking out
materials creates a massive issue. My CSU ID is not linked to my dead name, so
having to show my driver's license creates a huge issue.”
We next report results for the questions, “What
services do you believe Morgan Library can add to become a more inclusive and
welcoming space? Is there anything else you would like to tell us about Morgan
Library?” We received 131 responses, and all comments were coded when
applicable. As with the above question,
there were instances where the replies were not usable, and in these cases, the
comments were not coded. The top five codes were: “Space,” “Inclusion,”
“Technology,” “Collections,” and “Marketing.”
The most prominent code was “Space” (n = 41), which
was applied to any mention of the physical spaces within Morgan Library. One
student suggested, “More comfortable chairs. I have a lot of back problems so
that is a big issue for me.” Similarly, a student said, “Please make an area
for standing work, i.e. rising desks. Some of us can't sit for so long.”
Another student suggested creating more neurodivergent-friendly study spaces:
“Not have the study rooms be so echoey. The echoey spaces amplify the sound
inside of and outside of the study rooms and is incredibly distracting.
Especially for neurodivergent people, the extra amplified sound can make it
really hard to focus and feel comfortable in the space.” Another student
suggested “More reflection rooms with longer reservation times.” Additional
suggestions included “Easier elevator access” and “More study spaces for
students with disabilities.”
“Inclusion” (n = 21) was used to code all
suggestions for inclusive practices to make the library a more welcoming place.
Students had many ideas regarding this topic. Students suggested having
“Different languages being spoken when getting help,” coordinating “Meditation
training,” offering “Multicultural services,” and providing “Resources for
people struggling in school.” One student voiced concern about parking
affordability, “Make parking cheaper. Low income
students can’t afford the parking and so won’t use the library.” Finally, one
student suggested, “Tampons in every bathroom.”
The code “Technology” (n = 16) was applied to all
mentions of printing, computers, and software. In some cases, students made
various recommendations, and in other cases, students expressed their
satisfaction with current practices. For example, one student said, “Super
happy you all rent laptops. I am super poor and can’t buy one for myself. Had
it not been for this service I would not be graduating.” Many students advocated
for equitable financial policies. For example, one student commented, “I
returned a charger an hour late and was charged $8.00 which really sucked.”
Many students suggested “Free printing.”
“Collections” (n = 13) was used to indicate all
comments that referred to print and electronic resources. Students made many
suggestions about specific types of resources that would be helpful for
curating inclusive collections. Students suggested purchasing, “Textbooks for
short-term checkouts,” “Books from other languages,” “More books about LGBT
information, history and representation,” “Hispanic or Latino authors, work,
etc.,” and “Audio books & braille books.” Another student said, “It would
be awesome if there were more regular fiction contemporary/popular books.”
Comments related to the promotion of resources and
services were coded with “Marketing” (n = 11). There appeared to be confusion
over services offered in the library, and suggestions for remedying this issue
were provided. One student commented, “I think Morgan Library has inclusive
services. They just need to work on advertising those services to
underrepresented communities.”
Similarly, another student said, “I think they should have little
graphics about different tools they have because I feel like not a lot of
students know about different resources they offer and some people could really
use them.” Students made suggestions regarding marketing ideas, including,
“Have a big sign of things you can get at the help desk, on the wall as you
walk in” and “Better advertisement on the services work.” Additional topics
included “Staff” (8), “Programming” (n = 8), and “Wayfinding” (n = 6).
Discussion
This study aimed to investigate students’
perceptions of DEI within the library and to evaluate the library’s overall
effectiveness in cultivating a welcoming environment for all. To guide this
research, we focused on answering the following specific questions. The first
inquiry was concerned with whether students from historically marginalized
communities were less likely to perceive the library as an inclusive
environment. Overall, while most participants expressed positive feedback
regarding the measures used to evaluate inclusivity, further quantitative
analysis revealed that individuals who identified as nonbinary/genderqueer/gender
nonconforming, BIPOC, and those with disabilities were less likely to perceive
the library as inclusive. The second inquiry guiding this research was more
exploratory, focusing on identifying what factors influence students’ perceptions
of what constitutes an inclusive environment within the library. Through
thematic qualitative analysis, we discovered the following factors as being
instrumental in influencing perceptions of inclusiveness: space, collections,
displays, art, technology, programming, marketing, staff, and wayfinding.
Overall, students provided positive feedback across
all four quantitative measures for inclusivity (sense of belonging, frequency
of microaggressions, bias or discrimination, safety, and representation). The
majority agreed that the library fostered a sense of belonging, was welcoming,
and felt comfortable using library services and seeking assistance. Similarly
positive results in the other measures indicated that most students rarely
encountered microaggressions, bias, or discrimination, generally felt safe in
the library, and believed that the space sufficiently represented their
identities. Positive results such as these are not surprising, as other surveys
measuring student perceptions of libraries have reported similar outcomes.
Students surveyed at the University Library at the University of Illinois
Chicago similarly provided positive ratings regarding a sense of belonging,
respect for identities, and diverse/representative collections at their library
(Scoulas, 2021). Likewise, Morgan-Daniel et al.
(2022) also found a predominantly positive perception of their library’s DEI
climate and inclusivity, especially concerning feeling welcomed and safe from
physical harm.
On the surface, the positive results of this study
indicate that, by and large, the library is considered an inclusive space on
campus. However, it is necessary to dig deeper into the data to grasp the full
picture. More detailed analyses revealed that respondents with historically marginalized
identities were less likely to perceive the library as inclusive. Although the
effect sizes identified in this study were generally small according to
conventional standards, it's crucial to recognize that even statistically small
effects can yield serious consequences when impacting a large population over
an extended period (Funder & Ozer, 2019). A significant strength of this
study is the large sample size, which allows us to detect these concerns.
The negative ratings first appear in our analysis
while exploring gender identity. Respondents who identified as
non-binary/genderqueer/gender non-conforming were significantly less likely to
view the library as an inclusive space or welcoming and did not feel
particularly represented in the library as compared to cisgender men or women.
However, most concerning were the higher reports of experiences of
microaggression, bias, or discrimination, as well as not feeling safe to report
these incidents to library staff. Similarly, respondents who identified with
the LGBTQ+ community were also significantly more likely to report experiencing
microaggression, bias, or discrimination. While the results are disconcerting,
there exists a substantial body of literature delineating the experiences of
students encountering violence, harassment, and discrimination on campuses due
to their sexual orientation, gender identity, and gender expression (Waling
& Roffee, 2018). Libraries are not immune from
these adverse experiences, as multiple studies have underscored negative
encounters reported by patrons identifying with the LGBTQ+ community,
especially when seeking information related to LGBTQ+ or gender identity issues
(Hays, 2020). It is this fear of experiencing a negative reaction that may
explain the reluctance of non-binary/genderqueer/gender non-conforming
respondents in our study to reach out to library staff and report incidents of
microaggressions, bias, or discrimination.
When exploring the measures of inclusivity in
relation to race/ethnicity, significant findings appeared when comparing
respondents who identified as BIPOC to respondents who identified as White. One
of the first areas that showed significance was that BIPOC respondents were
less likely to feel safe reporting microaggressions, bias, and discrimination
to library staff. Interestingly, BIPOC respondents did not report significantly
higher experiences of microaggressions, bias, and discrimination; however, they
were less likely to report these incidents to library staff. The hesitancy of
BIPOC students to report instances of microaggressions, bias, and
discrimination to library staff reflects similar findings from the Duke
University Library (DUL) study. In that study, Black students believed that DUL
did not address racist incidents on campus and would not take sufficient action
to address reports of prejudice or microaggressions (Chapman et al., 2020).
However, the findings with the largest effect size for BIPOC respondents were
related to representation, with BIPOC respondents reporting that they were less
likely to feel represented in the library space, less likely to feel resources
offered at the library consider different identities, and less likely to feel
that the library showcases diverse identities throughout library spaces. These
findings are important because research suggests that students' perceptions of
belonging are strongly linked to the degree to which their identity is
represented on campus (Bucy, 2022; Chapman et al., 2020).
Stewart et al. (2019) emphasized that libraries
alone cannot solve these issues. The urgency and importance of creating an
inclusive environment requires a broad coalition across campus communities. To
address these concerns, CSU Libraries must collaborate with campus partners to
ensure that the campus community takes a holistic approach to make BIPOC
students feel that their identities are represented on campus and that they
feel safe reporting instances of microaggressions to campus employees.
Another group that showed significant findings in
relation to our measures for inclusivity was respondents who self-identified as
disabled. Respondents who identified as disabled were significantly less likely
to report that the library is inclusive, welcoming, or feel comfortable asking
for help. They also did not feel represented in the library space and were less
likely to report that the library did a sufficient job of showcasing diverse
identities throughout library spaces. However, the most pronounced finding for
this group, with the largest effect size, was their increased likelihood to
report experiencing microaggressions, bias, or discrimination, along with
feeling less safe reporting these incidences to library staff. Similar research
assessing DEI in a health sciences library also reported lower scoring response
rates for individuals with disabilities when asked to rate whether the library
met their needs (Morgan-Daniel et al., 2022). One possibility for the
propensity of negative attitudes about libraries among individuals with
disabilities is the failure of libraries to expand the concept of accessibility
beyond mere ADA compliance and truly consider the mobility needs of their users
comprehensively (Schomberg & Corley, 2022).
Recommendations
Through qualitative analysis of participants’
open-ended responses, we identified the following factors as central to
influencing perceptions of inclusiveness: space, collections, displays, art,
technology, programming, marketing, staff, and wayfinding. Based on this analysis,
researchers suggest implementing the following recommendations to improve
perceptions of inclusiveness.
· Create
inclusive and quiet study spaces to accommodate different learning styles and
preferences. Careful consideration should be given to creating a welcoming
space for neurodivergent learners.
· Purchase
furniture that suits all body types and learner needs, including adjustable
desks, adjustable chairs, and distraction-free furniture.
· Promote
scholarship of people of color and other marginalized identities through
displays and other programming.
· Create
a user-focused marketing plan that promotes library services and collections.
There is a disconnect between what services and collections we offer between
what students think is available.
· Display
inclusive artwork throughout the building that reflects a diversity of
identities.
· Invite
campus partners to the library and collaborate on programming and services.
Consider collaborating on study skills sessions, informational sessions, and
thematic events such as poetry readings.
· Provide
additional staff training on DEI topics, such as intercultural communication,
understanding oppression, microaggressions, and inclusive language, all of
which are offered by the CSU Office of Inclusive Excellence. Include student
employees in these training sessions.
· Improve
the wayfinding experience. Create and post clear and concise signage throughout
the library to enhance knowledge of elevators and gender-neutral bathrooms.
· Eliminate
barriers for patrons who identify as disabled. Provide more accessible
entrances and pathways throughout the building.
· Adjust
technology policies, access, and procedures to make them more accessible and
user-friendly.
Limitations and Future Research
The survey method is often used in Library
Information Science (LIS) because it is easily accessible and requires fewer
human resources than other research methods. Despite its convenience, it is
important to acknowledge the inherent limitations of solely relying on survey
data. For example, students may not accurately portray or feel comfortable
sharing their experiences during a survey. To gain a more holistic and accurate
picture, researchers suggest a follow-up study utilizing focus groups and photo
elicitation methods to gather deeper insight into inclusion in Morgan Library.
Conducting focus groups with our students will
provide a deeper understanding of their experiences at the Morgan Library.
Given the results of this study, focus groups should be tailored to elicit
feedback from the underrepresented and marginalized communities who expressed
the greatest concerns about inclusion in Morgan Library. This includes students
who identify as nonbinary/genderqueer/gender nonconforming, BIPOC, LGBTQ+, as well
as people who identify as disabled. Focus group questions should be developed
based on study results and aim to delve deeper into the students' experiences.
This approach will enhance the study by capturing the in-depth thoughts of our
student body.
To reduce bias and microaggressions, it is essential
to recruit moderators who share similar backgrounds with focus group
participants. Duke University Libraries successfully applied this strategy by
recruiting graduate students who identified as Black to moderate focus groups
exploring the experiences of Black students at Duke. To further reduce bias,
one of these graduate students, unaffiliated with the library, independently
analyzed the findings (Chapman et al., 2020). Even if exact matches between moderators
and participants cannot always be achieved, research indicates that focus
groups can promote more open and sensitive disclosures among participants with
marginalized identities. For instance, in a study conducted by Guest et al.
(2017), 350 Black men were randomly assigned to either focus groups or
individual interviews, where they were asked identical open-ended questions
about their healthcare-seeking behavior. Despite the moderator being a White
woman, participants in focus groups were more likely to reveal sensitive and
personal information than those in individual interviews. This suggests that
individuals with marginalized identities may feel more at ease sharing in a
group setting with others who share similar cultural backgrounds, as opposed to
a one-on-one interview with someone of a different gender and cultural
background. Employing the above strategies in a follow-up study will help
create a comfortable environment, encouraging participants to share more
openly.
Photo elicitation gives students the opportunity to
take photos of places in Morgan Library where they feel the most and least
comfort and representation. By coding all the photos, researchers will be able
to identify specific spaces within the library that are triggering students or
making them feel comfortable. This method will add value to the study by
capturing rich, multidimensional data and providing meaningful insight into the
daily lives of students.
The addition of this new data, used in tandem with
the survey results, will provide a more holistic and accurate picture of the
student experience in Morgan Library. However, we also note that the findings
of this study may not always generalize to other settings, as all participants
were drawn from the same university, which may reduce the diversity and
representativeness of the sample.
Conclusion
In this study, we sought to gain insight into what
factors influence students’ perceptions of an inclusive environment and whether
students from historically marginalized communities were less likely to
perceive the library as an inclusive space. Overall, the survey elicited
positive feedback, with most participants agreeing with the measures used to
assess an inclusive environment. In general, participants reported high levels
of satisfaction with the measurements for a sense of belonging, safety, and
representation. However, further analysis revealed that participants who
identified as nonbinary/genderqueer/gender nonconforming, BIPOC, LGBTQ+, and
individuals with disabilities were less likely to rate the library as an
inclusive, safe, or represented space. An examination of the qualitative data
revealed numerous pivotal factors shaping perceptions of inclusiveness,
including aspects such as space, collections, displays, art, technology,
programming, marketing, staff, and wayfinding. These mixed findings indicate
that although most students who visit the library find the environment
inclusive, more work is needed to create an inclusive and safe space for
students from historically marginalized communities.
Author Contributions
Khaleedah
Thomas: Conceptualization
(equal), Data curation (equal), Quantitative analysis methodology (lead),
Writing - original draft (lead), Writing - review & editing (lead) Meggan
Houlihan: Conceptualization (equal), Data curation (equal), Qualitative
analysis methodology (supporting), Writing - original draft (supporting),
Writing - review & editing (supporting)
Acknowledgments
We would like to express our gratitude to Dr.
Michael Thomas, Associate Professor of Psychology at Colorado State University,
for his valuable assistance in conducting statistical analyses. We would also
like to thank our colleagues Maddy Kling and Audrey Wilcox for their
contributions to the design and implementation of the survey.
References
Bodaghi, N. B., & Zainab, A. N. (2013). My carrel, my
second home: Inclusion and the sense of belonging among visually impaired
students in an academic library. Malaysian Journal of Library &
Information Science, 18(1), 39–54.
Bucy,
R. (2022). Native American student experiences of the academic library. College
& Research Libraries, 83(3), 416–433. https://doi.org/10.5860/crl.83.3.416
Chapman,
J., Daly, E., Forte, A., King, I., Yang, B. W., & Zabala, P. (2020). Understanding
the experiences and needs of Black students at Duke [Report]. https://dukespace.lib.duke.edu/dspace/handle/10161/20753
Cohen,
J. (1988). Statistical Power Analysis for the Behavioral Sciences (2nd
ed.). Routledge. https://doi.org/10.4324/9780203771587
Cohen,
J., Cohen, P., West, S. G., & Aiken, L. S. (2002). Applied Multiple
Regression/Correlation Analysis for the Behavioral Sciences (3rd ed.).
Routledge. https://doi.org/10.4324/9780203774441
Colorado
State University Libraries. (2021). Strategic plan. https://lib.colostate.edu/about/strategic-plan/
Colorado
State University Office for Inclusive Excellence. (2021). Employee Climate
Survey. Employee Climate Survey. https://cdn.prod.website-files.com/663a4f2aabeeb6eaf39d774d/66562d007a05f5d28aa47e92_CSU-ECS-2021-final.pdf
Couture,
J., Bretón, J., Dommermuth, E., Floersch, N., Ilett, D., Nowak, K., Roberts,
L., & Watson, R. (2021). “We’re gonna figure this out”: First-generation
students and academic libraries. Portal: Libraries and the Academy, 21(1),
127–147. https://doi.org/10.1353/pla.2021.0009
Dau,
D., & Strauss, P. (2016). The experience of lesbian, gay, bisexual, and
trans students at the University of Western Australia: Research report 2016.
Equity and Diversity, The University of Western Australia, Crawley. http://www.hr.uwa.edu.au/equity/sexualities/studylgbtstudents
Drake,
A. A., & Bielefield, A. (2017). Equitable access: Information seeking
behavior, information needs, and necessary library accommodations for
transgender patrons. Library & Information Science Research, 39(3),
160–168. https://doi.org/10.1016/j.lisr.2017.06.002
Funder,
D. C., & Ozer, D. J. (2019). Evaluating effect size in psychological
research: Sense and nonsense. Advances in Methods and Practices in
Psychological Science, 2(2), 156–168. https://doi.org/10.1177/2515245919847202
Gibson,
A. N., Chancellor, R. L., Cooke, N. A., Dahlen, S. P., Patin, B., &
Shorish, Y. L. (2020). Struggling to breathe: COVID-19, protest and the LIS
response. Equality, Diversity and Inclusion: An International Journal, 40(1),
74–82. https://doi.org/10.1108/EDI-07-2020-0178
Gibson,
A. N., Chancellor, R. L., Cooke, N. A., Park, D. S., Lee, S. A., & Shorish,
Y. L. (2017). Libraries on the frontlines: Neutrality and social justice. Equality,
Diversity and Inclusion: An International Journal, 36(8), 751–766. https://doi.org/10.1108/EDI-11-2016-0100
Guest,
G., Namey, E., Taylor, J., Eley, N., & McKenna, K. (2017). Comparing focus
groups and individual interviews: Findings from a randomized study. International
Journal of Social Research Methodology, 20(6), 693–708. https://doi.org/10.1080/13645579.2017.1281601
Hays,
A. (2020). A question of space: Surveying student usage of LGBTQ resources in
the LGBTQ student center library and the campus library. New Review of
Academic Librarianship, 26(1), 110–132. https://doi.org/10.1080/13614533.2018.1564336
Lyttan,
B., & Laloo, B. (2020). Equitable access to information in libraries: A
predicament for transgender people. Journal of Access Services, 17(1),
46–64. https://doi.org/10.1080/15367967.2019.1671850
Mahar,
A. L., Cobigo, V., & Stuart, H. (2013). Conceptualizing belonging. Disability
and Rehabilitation, 35(12), 1026–1032. https://doi.org/10.3109/09638288.2012.717584
Matheson,
M., Tait, E., & Reynolds, S. (2020). Checking the pulse of LGBTIQ+
inclusion and representation in the academic library: A literature review. Journal
of the Australian Library & Information Association, 69(1),
31–46. https://doi.org/10.1080/24750158.2019.1686571
Morgan-Daniel,
J., Norton, H. F., Adkins, L. E., Tennant, M. R., Edwards, M. E., & Daley,
M. (2022). Identifying diversity, equity, and inclusion enhancement
opportunities through an online mixed methods library survey. Journal of the
Medical Library Association, 110(4), 438–448. https://doi.org/10.5195/jmla.2022.1436
Office
of Regulatory Affairs and Research Compliance. (2020). ORARC Tip Sheet:
Inclusive Demographic Data Collection. Office of Regulatory Affairs and
Research Compliance. https://www.hsph.harvard.edu/regulatory-affairs-and-research-compliance/wp-content/uploads/sites/2352/2023/05/ORARC-Tip-Sheet-Inclusive-Demographic-Data-Collection.pdf
Ossom-Williamson,
P., Williams, J., Goodman, X., Minter, C. I. J., & Logan, A. (2021).
Starting with I: Combating anti-Blackness in libraries. Medical Reference
Services Quarterly, 40(2), 139–150. https://doi.org/10.1080/02763869.2021.1903276
Poudre
River Public Library District. (2021). Poudre River Public Library District
Patron Survey.
Ross,
P. T., Hart-Johnson, T., Santen, S. A., & Zaidi, N. L. B. (2020). Considerations
for using race and ethnicity as quantitative variables in medical education
research. Perspectives on Medical Education, 9(5), 318–323. https://doi.org/10.1007/s40037-020-00602-3
Sanchez,
M. E. (2019). Perceptions of campus climate and experiences of racial
microaggressions for Latinos at Hispanic-serving institutions. Journal of
Hispanic Higher Education, 18(3), 240–253. https://doi.org/10.1177/1538192717739351
Schomberg,
J., & Corley, C. (2022). Asking the right questions: Accessibility and
library study rooms. Journal of Library Administration, 62(4),
572–579. https://doi.org/10.1080/01930826.2022.2057134
Scoulas,
J. M. (2021). College students’ perceptions on sense of belonging and inclusion
at the academic library during COVID-19. The Journal of Academic
Librarianship, 47(6), 1–10. https://doi.org/10.1016/j.acalib.2021.102460
Silver
Wolf (Adelv unegv Waya), D. A. P., Perkins, J., Butler-Barnes, S. T., &
Walker, T. A. Jr. (2017). Social belonging and college retention: Results from
a quasi-experimental pilot study. Journal of College Student Development,
58(5), 777–782. https://doi.org/10.1353/csd.2017.0060
Stewart,
B., Ju, B., & Kendrick, K. D. (2019). Racial climate and inclusiveness in
academic libraries: Perceptions of welcomeness among Black college students. The
Library Quarterly, 89(1), 16–33. https://doi.org/10.1086/700661
Waling,
A., & Roffee, J. A. (2018). Supporting LGBTIQ+ students in higher education
in Australia: Diversity, inclusion and visibility. Health Education Journal,
77(6), 667–679. https://doi.org/10.1177/0017896918762233
Walton,
G. M., & Cohen, G. L. (2011). A brief social-belonging intervention
improves academic and health outcomes of minority students. Science, 331(6023),
1447–1451. https://doi.org/10.1126/science.1198364
Appendix
Survey Questions
1. Please select your age range.
o Under 18
o 18-24
o 25-34
o 35-44
o 45-54
o 55+
o Prefer not to disclose
2. Please
select your educational standing.
o Undergraduate student
o Graduate student
3. Please identify your gender. Check all that
apply.
* Woman
* Man
* Non-binary / Gender Queer / Gender Non-Conforming
* Trans / Transgender
* Cisgender
* Agender
* Two Spirit
*
The gender I most closely align with is
not listed (please specify) __________________________________________________
* Prefer not to disclose
4. Please identify your race/ethnicity. Check all that apply.
* White
* Black or African American
* Latina, Latinx, Latino
*
Indigenous, First Nations, American
Indian, or Alaskan Native
*
Asian (including East Asian, South
Asian, Southeast Asian)
*
Native Hawaiian or other
Pacific Islander
*
Arab, Persian, or other peoples of the
"Middle East"
* Prefer not to disclose
* Other (please specify)
______________________________________________
5. Please identify your sexual orientation. Check all that apply.
* Straight/Heterosexual
* Gay or Lesbian
* Bisexual
* Queer
* Asexual
* Prefer to self-describe: ____________________________________________
* Prefer not to disclose
6. Are you a first-generation college student?
o Yes
o Maybe
o No
7. Do you identify as a person with a
disability?
o Yes
o No
o Unsure
o Prefer not to disclose
8. How often do you visit Morgan Library?
o Daily
o More than once a week
o Once a week
o 1-2 times a month
o 1-2 times a semester
o Rarely or never
9. Please rate how much you agree with the following
statements.
|
|
Strongly disagree |
Somewhat disagree |
Neither agree nor disagree |
Somewhat agree |
Strongly agree |
|
Morgan Library is an
inclusive space. |
o |
o |
o |
o |
o |
|
Morgan Library is welcoming.
|
o |
o |
o |
o |
o |
|
I feel comfortable using
library services. |
o |
o |
o |
o |
o |
|
I feel comfortable asking
for help. |
o |
o |
o |
o |
o |
The next section of the survey will be about
microaggressions, biases, and discrimination.
Microaggressions are defined as verbal, behavioral,
and environmental actions that are often brief, and whether intentional or
unintentional, come across as derogatory, hostile, or include negative racial
slights and insults towards people of color (Sue et.
Al, 2007).
10. How often do you experience microaggressions,
bias, or discrimination in Morgan Library?
o Daily
o More than once per visit
o Once per visit
o Every other visit
o Rarely
o Never
11. Please rate how much you agree with the
following statements.
|
|
Strongly disagree |
Somewhat disagree |
Neither agree nor disagree |
Somewhat agree |
Strongly agree |
|
I feel safe from physical
harm, discrimination, or emotional harm at Morgan Library. |
o |
o |
o |
o |
o |
|
I feel safe reporting
microaggressions, bias, and discrimination to library staff. |
o |
o |
o |
o |
o |
|
Morgan Library can do more
to minimize microaggression, bias, and discrimination. |
o |
o |
o |
o |
o |
12. Please rate how much you agree with the
following statements.
|
|
Strongly disagree |
Somewhat disagree |
Neither agree nor disagree |
Somewhat agree |
Strongly agree |
|
I feel represented in Morgan
Library. |
o |
o |
o |
o |
o |
|
Resources offered at Morgan
Library take into consideration different identities. |
o |
o |
o |
o |
o |
|
Morgan Library showcases the
work of diverse identities throughout the library's space. |
o |
o |
o |
o |
o |
13. How can we represent your identity better in
Morgan library spaces?
The next section of the survey will address the
various services Morgan Library offers.
14. Please rate how often you use each service in
Morgan Library.
|
|
Never |
I-2 times per month |
1-2 times per week |
Everyday |
|
Loan & Reserve Desk,
book checkout |
o |
o |
o |
o |
|
Technology Loans (iPhone
chargers, laptops, etc.) |
o |
o |
o |
o |
|
Prospector and Interlibrary
Loan (ILL) (checking out materials from other libraries) |
o |
o |
o |
o |
|
Help Desk |
o |
o |
o |
o |
|
Printing Services |
o |
o |
o |
o |
|
Assistive Technology |
o |
o |
o |
o |
|
Research Librarians |
o |
o |
o |
o |
|
Archives & Special
Collections |
o |
o |
o |
o |
|
Geospatial Centroid |
o |
o |
o |
o |
15. Please rate how helpful you believe each service
is in Morgan Library.
|
|
Not Helpful |
Neutral |
Somewhat Helpful |
Helpful |
I have not used this service |
|
Loan & Reserve Desk,
book checkout |
o |
o |
o |
o |
o |
|
Technology Loans (iPhone
chargers, laptops, etc. |
o |
o |
o |
o |
o |
|
Prospector and Interlibrary
Loan (ILL) (checking out materials from other libraries) |
o |
o |
o |
o |
o |
|
Help Desk |
o |
o |
o |
o |
o |
|
Printing Services |
o |
o |
o |
o |
o |
|
Assistive technology |
o |
o |
o |
o |
o |
|
Research Librarians |
o |
o |
o |
o |
o |
|
Archives & Special
Collections |
o |
o |
o |
o |
o |
|
Geospatial Centroid |
o |
o |
o |
o |
o |
16. What services do you believe Morgan Library can
add to become a more inclusive and welcoming space? Is there anything else you
would like to tell us about Morgan Library?