Research Article
Plotting Your Job Hunt: The Use of Visual Timeline
for Investigating the Job Search Process
Natalia
Estrada
Digital
Scholarship Librarian
University
at Buffalo SUNY
Buffalo,
New York, United States of America
Email: nestrada@buffalo.edu
Received: 16 June 2025 Accepted: 15 Sept. 2025
![]() 2025 Estrada.
This is an Open Access article distributed under the terms of the Creative
Commons‐Attribution‐Noncommercial‐Share Alike License 4.0
International (http://creativecommons.org/licenses/by-nc-sa/4.0/),
which permits unrestricted use, distribution, and reproduction in any medium,
provided the original work is properly attributed, not used for commercial
purposes, and, if transformed, the resulting work is redistributed under the
same or similar license to this one.
2025 Estrada.
This is an Open Access article distributed under the terms of the Creative
Commons‐Attribution‐Noncommercial‐Share Alike License 4.0
International (http://creativecommons.org/licenses/by-nc-sa/4.0/),
which permits unrestricted use, distribution, and reproduction in any medium,
provided the original work is properly attributed, not used for commercial
purposes, and, if transformed, the resulting work is redistributed under the
same or similar license to this one.
DOI: 10.18438/eblip30826
Abstract
Objective – This article discusses the use of a
visual timeline activity in qualitative research investigating a process. This
was part of a larger project exploring the experience of former library staff
and their searches for academic librarian positions. It will also discuss the
impact a visual method had in shaping the quality of the data.
Methods – In 2023, the author conducted in-depth virtual interviews
with 22 former library staff working in U.S.-based academic libraries about
their experiences applying for academic librarian positions. A timeline
worksheet was incorporated into the interviews, in which participants were
asked to chronologically plot out their searches, as well as discuss
significance of their selections. Both transcripts and timelines were analyzed
using inductive thematic analysis, with the derived codes applied to both.
Timelines were analyzed for visual connection to themes.
Results
– Participants
used the timelines as a way to explain steps taken during their job searches, eventually
leading to the start of their new jobs. Completing the activity helped
participants recall moments from their searches during the interview. They also
used the visual format to express the emotions they felt and their sense of
passing time. Issues that arose while conducting the activity included some
participants’ fears of “doing [the activity] wrong,” as well as limitations of
the digital tool used to lead the interviews.
Conclusion – Qualitative research in library science
can benefit from the use of visual methods like timelines, especially for
research on procedural aspects of working in academic librarianship. While
practical matters such as extra time and material needs may hamper a
researcher’s desire to use them, visual data can supplement oral interview
transcripts.
Introduction
In-depth
interviews provide valuable insight into people’s experiences during and after
life events. However, there are times when it is difficult for interviewees to
verbalize concepts like time clearly. When it comes to understanding a sequence
of events, interviews may be muddled or difficult to imagine and understand.
There is also the issue of the power balance between researcher and subject.
Qualitative research can implement numerous methods for data collection. This
includes surveys, interviews, focus groups, and observation. Common among these
methods is the control investigators hold in the direction and interpretation
of the data collected. Participants are restricted to the questions asked in a
survey, the flow of the in-depth interview, and the amount of speaking time in
a focus group.
Time
is an abstract concept, where describing the past, present, and future is
difficult for anyone, let alone for an interviewee. Process can also be
considered abstract, but it relies on specific steps and time periods. Visual
tools can help deal with these issues in an attractive way. If applied, a
timeline tool may help participants discuss their experiences of a process in
more detail. Data collection tools that incorporate visual creation can provide
ways to expand on participants’ understanding of abstract concepts. Such
methods include photovoice and mind mapping. Visual methods can also act as
memory aids, where they help participants focus on and recall significant
events related to the research question (Kolar et al., 2015). They can lead
to reflection on important moments in interviewees’ histories (Chen, 2018; Thygesen
et al., 2011). While fields such as public health and
anthropology have used such tools for the past few decades, library science
research has started to catch up and incorporate them into projects.
This
article will cover the use of a visual timeline, in combination with
interviews, in a qualitative research project and argue the benefits of
implementing timelines as a data collection tool for investigations of
processes. This work is part of a larger project exploring the academic
librarian job search experience from the perspective of former library staff[1]
who have worked in academic libraries based in the United States. Here, I
explain the way timelines were implemented and analyzed, notable data, and
recommendations from this methodology.
Literature Review
Visual Tools in Qualitative Methods
Literature
discussing the use of visual data collection tools explores a wide collection
of their forms. This ranges from photos, videos, drawings, collages, and even
Legos. Much of the rationale behind the use of visual methods focuses on
enhancing data collected through interviews (Adriansen, 2012; Bagnoli, 2009;
Kolar et al., 2015; Pell et al., 2020). In addition to
the content of interview data, forms and styles of visual data can be analyzed
to derive possible meanings and thought processes. These methods can also help
situate moments from interviews or explain participants’ understanding of
certain concepts and situations (Bagnoli, 2009). Interviewees
tend to be more engaged in the interviews when completing visual exercises (Kolar et al., 2015).
Visual tools can also aid in the practice of prompting, to encourage
interviewees to expand on a comment or thought. Drawing attention to the photo,
drawing, or collage and asking for an explanation of a feature can invite
participants to go into more detail, adding to the interview data (Sheridan et al., 2011).
Additionally,
incorporating visual methods—especially participatory methods—balances power
dynamics between researcher and subject (Adriansen, 2012; Hicks, 2018; Mannay, 2010). Typically, the
researcher controls the flow of interviews and the meaning derived from those
transcripts. Previous research discusses control given to participants in
completing these exercises, including determining their own forms and styles.
In Kolar et al. (2015), participants created spiraling timelines that provided
extensive details in drawings of abstract concepts. With visual methods,
participants can guide the way their materials are interpreted, as opposed to
ceding control to the researcher. The researcher’s main role in those
situations is to ask creators about meaning from participants’ works (Sheridan et al., 2011). In
certain instances, researchers have been prevented from seeing the products of
visual data collection prior to analysis, such as in cases involving interviews
over phone and other non-face-to-face formats (Pell et al., 2020).
The
selection of the type of visual method depends on the research question. Most
of the styles previously discussed are used to explain understandings and
reflections. Timelines, however, represent a chronological order of significant
events (Pell et al., 2020). Previous
research has noted the advantage of timelines in their specific projects. The
direct advantage found in almost all these projects was that it aided their
subjects in remembering relevant events in their lives. Pell et al. (2020)
pointed to their timelines in aiding their interviewees to answer questions
quickly, clearly, and confidently. Others such as Kolar (2015) and Andresen
(2012) point to the use of the timelines in helping address concerns of
interviewing marginalized communities such as refugees.
The
literature emphasizes that visual methods tools are not meant to be the sole
source of data; they are meant to supplement interview data (Adriansen,
2012; Hartel, 2014; Kolar et al., 2015; Pell et al.,
2020). The end results of visual methods are difficult to
understand when divorced from context. They need the participants'
interpretation to be understood. Each subject has their own way of
communicating concepts visually. Visual methods also face the issue of validity
(Hicks, 2018; Pollak, 2017),
especially when considering the individual aspect of each visual entry. One
must consider, though, that concerns of validity pertain to most qualitative
research (Cox & Benson, 2017). As
a bit of an outlier, Bagnoli (2009) argues that while they also do
not think visual data should be used as the only data in research, they view it
as, “significantly contributing to making sense at all different stages in the
analytical process” (p. 567). On the value of visual data collection, all of
these considerations may lead researchers to conclude:
In terms of worthy topic or
significant contribution, it seems less obvious that use of visual methods
inherently affects this either way; except perhaps in terms of the potential
for opening up new types of question in visual, non-textual communication and
consumption of information. (Cox & Benson, 2017, Discussion and Conclusion
section, para. 4)
Applications in Library Science Research
Library
science has begun to incorporate visual methods into qualitative research,
including studies of topics like the perception of information (Hartel, 2014) and a map of
the internet (Scull et al., 1999). Pollack (2017)
argues that library science has been slow in adopting visual methods due to the
field’s focus on more high-level and contextual topics. In the past decade or
so, the field has critically examined using visual methods for research. On the
one hand, there is consensus with discussion in other fields supporting use of
visual methods, such as how these tools can help balance power dynamics,
provide additional data supporting interviews, and allow various
interpretations of data (Adriansen, 2012; Bagnoli, 2009; Barton, 2015; Kolar
et al., 2015; Mannay, 2010; Sheridan et al., 2011). On the other
hand, there are some concerns, including one brought up only by library science
researchers. As previously discussed, there is the concern of using visual
tools as the sole method of data collection (Bagnoli, 2009), though Hartel (2014) argues for their validity as
their own data collection methodology. Another concern centres around the issue
of copyright. Droog et al. (2023) argue that participants hold
copyright of the images they create in these studies. That means participants
have the right to decide whether their images are disseminated as part of the
larger research output. However, the copyright issue is usually not considered
nor mentioned in either the IRB protocol stage or in consent forms. Beyond
copyright, there are also practical issues to consider, such as the need for
additional materials, time, and availability, which have not been addressed in
the literature.
Despite
these issues, library science scholars have found value in using visual
methods. These arguments centre the advantages of participatory methods, where
the study subject is actively engaged. Hicks (2018) focuses on one of the most
popular qualitative analytical approaches, grounded theory, and notes:
The exclusion of participatory
approaches to data collection such as visual methods presents issues because it
restricts grounded theory analysis to outsider rather than to the
harder-to-access emic or insider viewpoints that are revealed through the
adoption of a participant-centred approach. (p. 194)
Librarian Job Searches as a Process
To
get a librarian job in academia, especially in the United States, one must go
through a strenuous hiring process. The traditional job search for non-academic
positions tends to involve submitting a resume and brief cover letter and
partaking in a short interview. However, applying for academic librarian
positions carries more steps: submitting a curriculum vitae (CV) and a more
detailed cover letter; waiting for an invitation for a first-round phone or
Zoom interview; and, if selected to advance in the process, participating in a
final all-day campus interview involving meetings throughout the day with
subsets of stakeholders and a presentation.[2]
There are general guides on how to succeed in the process (Duffus,
2019; Weak, 2014; Welsh et al., 2023), including an
entire book (Meggan Press’s [2020] Get the Job: Academic Library
Hiring for the New Librarian ), but there isn't a detailed explanation of
how long the process may take, especially if the institution does not follow
the standard process. This can lead to anxiety for applicants, as well as
possible frustration for hiring institutions. For applicants, the entire
process, especially for failed applications, can stay in their mind for years
due to the amount of time and energy required. In the literature about
librarian hiring, there has been a lot of focus on both new and early career
librarians (Burns & Fargo, 2019; Holt & Strock,
2005; Iglesias et al., 2023, 2024), which reflect
general experiences among applicants. While useful, there is a need to look at
specific populations, such as former library staff. This group has experience
with the job application process at libraries, which is useful for comparing
with the academic librarian process.
Research
relating to library and hiring practices have been conducted through surveys (Eckard et al., 2014; Iglesias et
al., 2023), interviews (Reed et al., 2015), and a
combination of both (Burns & Fargo, 2019).
These methods rely on participants’ memories of the steps taken and their
emotional states during that time. However, they do not explore in detail the
variance in experiences of the participants' searches. Since job searches are
processes with an end goal, involving intensity, content, and temporality (Wanberg et al., 2020), they are able to be explored
with a visual method like the timeline.
Aims
This
study is part of a larger project[3]
focused on the experience of applying for academic jobs from the perspective of
former library staff, including examining the unique barriers this group faced
in the search process. Research objectives associated with this project include
assessing measures taken to prepare for the job search and ways the process
could be improved for former library staff.
For
the aspect of the study reported here, the researcher considered the following
questions when implementing the visual timeline activity:
·
How did timelines assist, if at all, in
data collection?
·
What are the advantages and
disadvantages of using this activity for this project?
·
How did participants respond to the
activity?
Methodology
Using
the Zoom whiteboard feature, the researcher created a timeline worksheet that
would provide a starting point for interviewees, with few restrictions in how
they completed it. The visual construction of the worksheet consisted of two
vertical stripes, representing starting and ending posts, connected by a long
horizontal line (Figure 1). This horizontal line was a representation of the
distance between the two posts measured in time. It also provided space for
participants to enter what they considered important moments during their job
searches. The left vertical post was labeled “start of job search” and the
right post was labeled “start of new job.” Establishing these points provided a
framework in which interviewees could add their experiences. However, they were
free to establish their own definitions of beginnings and endings, which led to
a variety of ways in which participants completed this exercise. Although the
researcher explored other timeline models, this style was developed and
selected for this project. It was pilot tested with a volunteer not participating
in the study to ensure suitability and determine any needed changes.
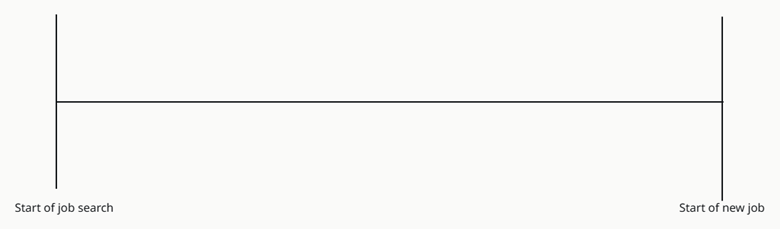
Figure
1
Timeline
template used for data collection.
In
the summer of 2023, the researcher put out a call for interview participants
(CFP) through both the Association of College and Research Libraries (ACRL) and
American Library Association (ALA) Connect electronic mailing lists.
Respondents completed a screener survey, included in the CFP, to ensure they
met the qualifications for interviews. The researcher conducted a series of
semi-structured interviews, including open-ended questions, with 22
participants about their job search experiences. Participants were current
librarians who held library staff positions before becoming librarians. For
this project, library staff are defined as workers who work in all levels of
library operation. Examples of these positions include circulation assistant
and technical processing assistant. ALA notes the difference between library
staff and librarian is the holding of an MLIS, yet the Association acknowledges
that staff can also hold an MLIS but not be in a librarian position. Each
semi-structured interview focused on the participant’s previous work
experiences, what led them to start searching for librarian positions, and
their memories of the whole experience. Halfway through each interview, the
researcher introduced the timeline worksheet. The researcher asked participants
questions during this activity, such as what emotions they remembered
experiencing at highlighted points. Near the end of the interview, and once the
participant declared they had finished the activity, the worksheet was closed.
All interviews were recorded and, along with the worksheets, saved locally.
The
protocol for this research project was reviewed and approved by the
Institutional Review Board at the University at Buffalo (STUDY00007141). All
participants who qualified were sent written consent forms and a copy of the
interview questions before their interviews. The researcher also confirmed
participants’ consent at the start of their interviews. Interviewees were able
to stop the interview and withdraw from the study at any time.
Data
analysis for the timelines followed the same method used for the interviews.
The researcher followed the practise of inductive thematic analysis, in which
codes and themes are developed when looking through the data without a
predetermined codebook. The researcher identified codes during data analysis
using the tips proposed by Ryan and Bernard (2003) (Guest et al., 2012). As compared
with the interview transcripts, when analyzing the timelines, there was more
focus on form, visual representations, selected representation of chronological
order, and other modes participants selected to complete their worksheets. If,
for example, participants drew a frowning face or used a frowning face emoji (🙁), that image would fall under the
“Emotions” code.
Limitations
The
interview questions were sent to participants 24 hours in advance to ensure
that they were aware of the potential flow of the interviews. A resulting trend
the researcher noticed during interviews was that many of the participants came
prepared with notes. They tended to refer to their notes while completing their
timelines. This may have had an impact on information given during the
worksheet activity: They were able to refer to their notes, instead of relying
on memory recall. This may affect one purpose of these types of activities: to
aid in memory recall. It then becomes difficult to understand which helped
more: the timelines, or the participant’s notes. Future research should
consider ways to limit participant use of notes, weighing issues surrounding
equity and potential participant withdrawal from the study, or utilize a
different method to run the timeline exercise.
Although
there were attempts to ensure accommodations for as many participants as
possible, the researcher failed to account for the accessibility of the digital
whiteboard tools. The whiteboard feature on Zoom is difficult to connect with
screen readers. Visually impaired users were likely not willing to volunteer
for a project that did not accommodate their needs. For future projects, the
researcher plans to mitigate this with alternative tools and possible
collaboration with accessibility experts.
Resulting
timelines should not be considered a general representation of this population
due to the number of subjects involved. In order to enroll a sufficient number
of people meeting the criteria for the study, the call for participants went
through ACRL and ALA Connect. This resulted in a sizable number of people to
interview, but with an oversaturation of participants: 21 out of 22 identified
as White and all but 5 identified as cisgendered
women, a result of the profession being predominantly White women. This study
had a U.S. focus, as the researcher is based in the US and the electronic
mailing list used in the CFP has a majority U.S. subscriber base, though
Canadian universities are modestly represented on the list. While a few of the
study participants had been previously employed in academic libraries outside
the US, there were too few to represent workers with that experience, nor does
this sample represent workers globally. The researcher should have considered
reaching out to specific professional organizations like the Black Caucus of
ALA (BCALA), REFORMA (the National Association to Promote Library and Information
Services to Latinos and the Spanish Speaking), and Asian Pacific American
Librarians Associations (APALA) to ensure a better representation of ideas and
approaches.
Results and Analysis
A
total of 39 people completed the screener survey, and all but one met the
qualifications for interview participation; 35 of those volunteered to be
interviewed and listed their contact information. Of those, 23 replied to the
researcher’s invitation for interviews and confirmed their willingness to be
interviewed. One participant withdrew from the project before their interview.
In total, 22 participants completed the interview and visual timeline.
Near
the end of the interview, participants were asked to disclose any demographic
information they felt may have had some effect on their job search. The
question was presented in an open-answer format, as to not exclude any
information they felt was important to their identity. This also allowed
participants to have control over the amount of identifying information shared.
The
demographic profile of the interviewees was predominantly White and cisgendered women; 21 (95%) of the participants identified
as White and 1 (5%) as Native American (Table 1). Cisgendered
women represented 16 (73%) of the participants, and there were 5 (23%) cisgendered men and 1 (5%) nonbinary person. Five (23%)
people identified as queer. There were 9 (41%) who held a second master’s (MA)
degree, in addition to a Master of Library and Information Science (MLIS) or
its equivalent. Within the study participants, 2 (9%) identified as disabled, 2
(9%) were the first generation in their family to graduate college, and 1 (5%)
was a military veteran.
Table
1
Open-Answer
Demographics Given by Participants During Interviews
|
Demographic |
Number of Participants |
Percent of Total (%) |
|
none |
21 |
95 |
|
Native
American |
1 |
5 |
|
Cisgendered
Woman |
16 |
73 |
|
Cisgendered
Man |
5 |
23 |
|
Nonbinary |
1 |
5 |
|
Queer |
5 |
23 |
|
Disabled |
2 |
9 |
|
First
Generation |
2 |
9 |
|
2nd
MA Degree Holder |
9 |
41 |
|
Military
Veteran |
1 |
5 |
From
both the interview transcripts and the timeline data, the researcher created
the following codes. The most commonly used code for the worksheets was “Job
Search Process”:
·
Background
·
Workplace Issues
·
Information Sources
·
Job Search Process
·
Job Search Issues
·
Emotions
The
timelines were formatted in a linear format. This allowed participants to place
events in chronological order, and it appeared that this format allowed
participants to remember the order of events of their searches. Many
participants were able to include clear months and dates, though some did not
go into that specificity in their worksheets. Many of the participants began
entering elements on their timelines using the moment they began considering
and looking for academic positions as the first marker. From there, they gave a
variety of information about their process: when they earned degrees, when they
moved to different cities, when they informed colleagues about looking for
jobs, and others. Most commonly, they pointed to interview invitations and job
offers as significant markers.
Participants
reported a range of years in which they began their job search. Among those
reporting, 8 (36%) started their search between 2019 and 2023, 5 (23%) started
between 2013 and 2018, and 7 (32%) started prior to 2013 (Table 2). The number
of years participants were able to recall varied for all starting years prior
to 2023. Participants were able to remember 1 to 37 years in their timeline,
with the average being 7 years. Most of the participants, especially those who
began their job search 5–10 years ago, tied their starting points to when they
earned their MLIS or when they became frustrated with their staff positions.
Those who began their job search less than 5 years ago commented on how recent
their experiences were, with mentions of the early years of the COVID-19
pandemic and “Zoom school.” Participants recalling job searches more than 10
years ago were still able to give details of their search experiences,
connecting them with either important moments in their personal lives (3
participants referenced the 2008 recession), or with parts of their job
searches that are no longer in practice (the participant who recalled their
search 37 years ago described their experience having to submit their CV in
“this big room that had three-ring binders with all of the jobs”). As this was
an open-ended question, and participants had the freedom to select their
version of starting the job search, 2 interviewees did not give years. One
could not recall the specific year; the other selected not to include a
specific year.
Table
2
Number
of Participants With Selected Job Search Start
Dates for Timelines
|
Start Years |
Number of Participants |
Percent of Total (%) |
|
2019–2023 |
8 |
36 |
|
2013–2018 |
5 |
23 |
|
Before
2013 |
7 |
32 |
|
Unknown |
2 |
9 |
Many
participants relied heavily on text in creating their timeline. This included
listing when they submitted applications, when they were invited for
interviews, and any emotions that they felt. At times, they also used text to
explain moments or outside influences that affected their searches. A few
participants used visual posts or sticky notes to enter chronological events.
Others included visual representations of emotions, using emojis or freehand
drawing.
Many
of the timelines included information about the number of interviews
participants had, order of interviews, and when participants received hiring
decisions. Some participants noted and marked times in their searches that they
found frustrating; these events were coded as “Job Search Issues.” Such markers
included search committees dismissing previous work experience during
interviews, failed negotiations, and, as seen in
Figure 2, events out of participants’ control.

Figure
2
A
former cataloging assistant noting an event affecting their search.
In
connection with the interviews, various entries on the timelines prompted the
researcher to investigate further. If participants entered a moment on their
timeline that seemed interesting, the researcher was able to point to that and
ask them to discuss more about the context behind the moment, as well as why
they included it on their timeline. For example, during the interview with the
creator of Figure 3, the researcher inquired about a sticky note near the end
of the timeline that didn’t yet have text in it:
Researcher: I noticed that you
have the little blue sticky and I was wondering
what you were gonna put in it, was that gonna say in there … What were you gonna
say?
Participant: I probably said it
out loud because it's hard, you know, typing and talking. But, yeah … oh, maybe I was gonna
say started or are offered or?
The
participant eventually remembered that they started their new position on a
certain holiday. Others selected as relevant markers moments when they were
rejected for other positions, strife at their previous positions that led to
their desire to move on from their position, or when they earned their MLIS
degree.
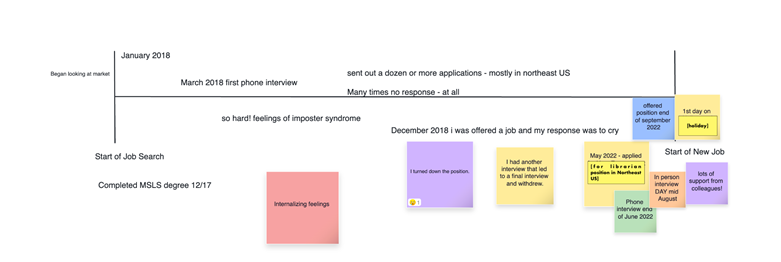
Figure
3
Timeline
using multiple formats created by a former reference assistant.
Participants
used the timeline to express their emotional state during their search in a
variety of interesting ways. Some increased font sizes or used larger sticky
notes to point to heightened stress or fear. In Figure 3, the creator used a
combination of font and sticky note sizing, as well as emojis, to convey the
mainly negative emotions they experienced during their job hunt. Readers can
also see a sticky note marking the end of their timeline: The day they started
their new academic librarian position.
As
intended, participants used the visual timeline to convey the length of time
between each point of their job search. Many highlighted the amount of time
between submitting their applications and when they received an invitation for
an initial interview. In Figure 4, the creator used purposeful spacing between
dates to highlight the length of time elapsed from the start of their search up
to when they began to hear from the institution that eventually hired them.
This space reflected the amount of time spent on application materials (“I
would tend to rewrite a full cover letter. … I would update my CV, if anything
had changed, and I would throw it in and hope for the best,” they said, “and
that was time consuming”) while dealing with multiple unsuccessful interviews.
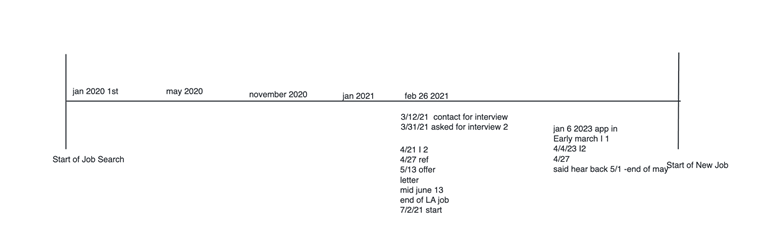
Figure
4
Timeline
using text and space created by a former reference assistant.
Not
all participants used the visual elements available to them to complete their
timeline; many used predominantly text with linear markers and, in one
instance, a bulleted list to go through the timeline of their process as they
saw it, ignoring the template for the exercise. Those who used text used it to
fully answer questions in the exercise as opposed to either summarizing or
marking along the timeline, as seen in Figure 2. In many of these instances,
participants said they had difficulty conversing with the interviewer while
completing the worksheet. Others noted their unfamiliarity with the Zoom
Whiteboard tool.
Discussion
The
timelines created during this study demonstrated both the strengths and
weaknesses of the format. The activity allowed an alternative way for
participants to discuss their experiences. Many took the chance to use the
visual elements to answer many of the interview questions. The sticky note
feature offered in Zoom Whiteboard was very popular, acting as a stand-in for a
large sheet of paper and physical sticky notes used in group collaboration.
Those who came to the interview prepared with notes appeared to enjoy using the
worksheet to translate their notes to visual form. Participants also used the
tools available to talk about their feelings. Tools like emojis and pencils
made it easy to relay common facial expressions (smiles or crying) and quickly
express how they felt during various recalled moments. The ability to play with
more subtle options, such as size and fonts, gave participants another way to
convey how they felt and perceived their experiences.
As
mentioned, the timeline played a role in helping participants remember moments
in their job searches. During traditional in-depth interviews, a good
interviewer can remember parts of the conversation and ask the participant to
return to and expand on a specific moment, although the interviewer may forget
to do this or distort the flow of the conversation. With the visual aid,
though, it was easier for the researcher to revisit moments outlined on the
timeline with participants without disrupting flow or losing train of thought.
There were many opportunities for the researcher to select parts of timelines
and ask participants why they decided to include those life moments. Even the
participants who had notes created moments in their timeline that led to
prompting opportunities.
One
of the main limitations of the timeline activity was the platform used: Zoom
Whiteboard. Many participants were unfamiliar with the platform and had
hesitation in using the tool and completing the activity. The platform also has
inherent limitations. For example, a limited number of tools were available for
entries: the text box, the preset sticky notes, the
pencil, and the emojis. This may have limited participant ability to express
their job search process. Had this exercise been done in physical proximity,
with markers and paper, participants would have had more options and more
freedom to complete their timeline.
Another
limitation that came up during this study was the concern participants had
about completing the activity incorrectly. While
they were told that there was no wrong way to complete their worksheets, a few
participants still expressed concerns of, as one put it, “doing it wrong.”
Participants may have experienced anxiety over not meeting a standard or what
they imagined was expected of a good timeline. Participants may have also had
anxiety over not providing enough quality information for the study. Some participants viewed the timeline
activity as extra work and had hesitation in doing it. Many were not used to
doing such an activity and may have considered participating in such an interview
outside the norm. Others may have been hesitant about having the researcher
watch them complete the activity. A few expressed little desire
to engage with the activity.
Consideration
should also be given to how time is perceived. Visual representation of
important events on a timeline may be interpreted differently depending on a
person’s cultural background and personal experiences. Whereas there is a
predominant perception of time as linear in many cultures, some cultures view
time in a circular fashion. A participant’s personal experiences may lead them
to focus on life events that are not relevant to the discussion but, from the
perspective of the participant, provide context. Future research should
consider more freeform methods of visual representation so that participants
may share concepts like order of events and their views of a process in a less
restrictive framework.
Future
research using visual methods should also address visual impairments. A recent
Zoom update affected the accessibility of the whiteboard feature; the update
created issues for users who are connecting screen readers with the whiteboard (“Zoom Accessibility,” 2024). While some products, like Miro,
advertise themselves as accessible, blind and visually impaired users consider
them falling short (Marathe & Piper, 2025). There remains a need for
accessible digital whiteboards. Researchers should collaborate with digital
accessibility experts and visually impaired users to identify and assess
alternative tools. Certain visual exercises may be more difficult to complete
for participants with mobility issues, as pointed out by one participant in
this study with mobility issues in their arms.
Another
issue that future researchers must consider is the ability for participants to
access the digital platform hosting the worksheets. Anything cloud based, like
Google Workspace and Microsoft 365, may have access restrictions for individuals
without accounts for those products. An early plan for this study to use a
Google tool had to be changed to Zoom Whiteboard because some participants did
not have a Google account and had a hard time accessing the worksheets.
A
final consideration for participatory visual exercises is the issue of
copyright. While factual data cannot be copyrighted (Cornell Data Services, n.d.), works that are
considered creative expressions can be. This raises the question of whether
creators of art-centred data own the copyright to their images. Guidance on the
use of copyrighted materials, such as archival materials, is available (Qualitative Data Repository, n.d.;
Social Science Research Council & Qualitative Data Repository, n.d.), but
there is little on the question of expressive data. Droog
et al. (2023) suggest including information of
participants’ copyright in consent forms. This suggestion is worth considering.
Research
that incorporates visual methods provides an alternate modality of
communication: Participants’ drawings illuminate data differently. Visual
methods meet the needs of participants who express their thoughts and ideas
better visually, as opposed to verbally. Expanding visual methods to media such
as fiber arts, sculpting, and more can lead to developing a fuller outcome for
qualitative research.
Conclusion
This
study incorporated a visual timeline exercise into semi-structured interviews
in order to investigate the job search experiences of former library staff.
Using the timeline helped expand participants' memories of their searches and
conveyed their sense of time. Incorporating timelines and other visual methods
into library science research has several benefits: Visual data can supplement
interview data, allow for artistic expression, and assist researchers in
prompting during interviews. Timelines can also be incorporated into other
forms of librarianship. For example, this visual method can be used with
students to work out steps involved in finding and using information resources
for class assignments. While practical and ethical issues remain to be
resolved, such as the financial costs of certain tools and the treatment of
images as objective, timelines can serve as a beneficial addition to qualitative
data collection.
References
Adriansen, H. K. (2012).
Timeline interviews: A tool for conducting life history research. Qualitative Studies, 3(1),
40–55. https://doi.org/10.7146/qs.v3i1.6272
Bagnoli,
A. (2009). Beyond the standard interview: The use of graphic elicitation and
arts-based methods. Qualitative Research, 9(5),
547–570. https://doi.org/10.1177/1468794109343625
Barton,
K. C. (2015). Elicitation Techniques: Getting People to Talk About Ideas They
Don’t Usually Talk About. Theory & Research in Social Education, 43(2),
179–205. https://doi.org/10.1080/00933104.2015.1034392
Burns,
D., & Fargo, H. (2019, August 7). “All I did was get this golden ticket”:
Negative emotions, cruel optimisms, and the library job search. In the Library with the Lead Pipe. https://www.inthelibrarywiththeleadpipe.org/2019/golden-ticket/
Chen,
A. T. (2018). Timeline drawing and the online scrapbook: Two visual elicitation
techniques for a richer exploration of illness journeys. International Journal of Qualitative Methods, 17(1). https://doi.org/10.1177/1609406917753207
Cohen,
R. A., Cooke, P. D., Holt, M., Lounsberry, M., Roga, E., Farrell, K. S., & Squires, J. (2025).
Autistic librarians in the academic library hiring process. College & Research Libraries, 86(5),
705. https://doi.org/10.5860/crl.86.5.705
Cornell
Data Services. (n.d.). Introduction to
intellectual property rights in data management.
Cornell University. https://data.research.cornell.edu/data-management/sharing/intellectual-property/
Cox,
A., & Benson, M. (2017). Visual methods and quality in information behaviour
research: The cases of photovoice and mental mapping. Information Research, 22(2),
749. https://www.informationr.net/ir/22-2/paper749.html
Droog, A., Weaver, K.
D., & Brady, F. (2023, March 9–10). The
seen and the unseen: Grappling with the benefits and drawbacks of visual
methods in LIS research [Conference
session]. Empirical Librarians Conference, Richmond, VA, United States. https://osf.io/nv6pb
Duffus, O. (2019). The
art and science of securing a job in an academic library: Landing your first,
or next, position. College &
Research Libraries News, 80(3),
145–148. https://doi.org/10.5860/crln.80.3.145
Eckard,
M., Rosener, A., & Scripps-Hoekstra, L. (2014).
Factors that increase the probability of a successful academic library job
search. The Journal of
Academic Librarianship, 40(2),
107–115. https://doi.org/10.1016/j.acalib.2014.02.001
Guest,
G., MacQueen, K. M., & Namey, E. E. (2012). Applied
Thematic Analysis. SAGE Publications.
Hartel, J. (2014). An
arts-informed study of information using the draw-and-write technique. Journal of the Association for Information Science and Technology, 65(7),
1349–1367. https://doi.org/10.1002/asi.23121
Hicks,
A. (2018). Developing the methodological toolbox for information literacy
research: Grounded theory and visual research methods. Library &
Information Science Research, 40(3–4),
194–200. https://doi.org/10.1016/j.lisr.2018.09.001
Holt,
R., & Strock, A. L. (2005). The entry-level gap:
Breaking in to the profession is harder than
ever--If you’re fresh out of library school. Library Journal, 130(8), 36–38.
Iglesias,
A., Mahama, L., & Gard, C. (2024). Pursuing academic librarianship:
Pathways to librarian positions. Practical Academic
Librarianship: The International Journal of the SLA Academic Division, 14(1),
23–85. https://pal-ojs-tamu.tdl.org/pal/article/view/7182
Iglesias,
A., Mahama, L., Gard, C., & Schirmer, T. (2023). Pursuing academic
librarianship: Factors affecting job attainment. The Journal of
Academic Librarianship, 49(4),
102751. https://doi.org/10.1016/j.acalib.2023.102751
Kolar,
K., Ahmad, F., Chan, L., & Erickson, P. G. (2015). Timeline mapping in
qualitative interviews: A study of resilience with marginalized groups. International Journal of Qualitative Methods, 14(3), 13–32. https://doi.org/10.1177/160940691501400302
Mannay, D. (2010).
Making the familiar strange: Can visual research methods render the familiar
setting more perceptible? Qualitative Research, 10(1),
91–111. https://doi.org/10.1177/1468794109348684
Marathe, A. S., & Piper, A. M. (2025). The
Accessibility Paradox: How Blind and Low Vision Employees Experience and
Negotiate Accessibility in the Technology Industry. Proceedings of the ACM
on Human-Computer Interaction, 9(7), 1–25. https://doi.org/10.1145/3757666
Pell,
B., Williams, D., Phillips, R., Sanders, J., Edwards, A., Choy, E., &
Grant, A. (2020). Using visual timelines in telephone interviews: Reflections
and lessons learned from the STAR Family Study. International
Journal of Qualitative Methods, 19. https://doi.org/10.1177/1609406920913675
Pollak,
A. (2017). Visual research in LIS: Complementary and alternative methods. Library & Information Science Research, 39(2),
98–106. https://doi.org/10.1016/j.lisr.2017.04.002
Press,
M. (2020). Get the job:
Academic library hiring for the new librarian. Association of College and Research Libraries.
Qualitative
Data Repository. (n.d.). Preparing a data
project: Organization and documentation. Center for
Qualitative and Multi-Method Inquiry, Maxwell School of Citizenship and Public
Affairs, Syracuse University. https://qdr.syr.edu/guidance/managing/preparing-data
Reed,
J. B., Carroll, A. J., & Jahre, B. (2015). A cohort study of entry level
librarians and the academic job search. Endnotes: The
Journal of the New Members Round Table, 6(1), 1–22.
Ryan,
G. W., & Bernard, H. R. (2003). Techniques to Identify Themes. Field
Methods, 15(1), 85–109. https://doi.org/10.1177/1525822X02239569
Schilperoort, H., Quezada,
A., & Lezcano, F. (2021). Words matter:
Interpretations and implications of “para” in paraprofessional. Journal of the Medical Library Association, 109(1),
13–22. https://doi.org/10.5195/jmla.2021.933
Scull,
C., Milewski, A., & Millen, D. (1999).
Envisioning the Web: User Expectations about the Cyber-experience. Proceedings
of the ASIS Annual Meeting, 36, 17–24.
Sheridan,
J., Chamberlain, K., & Dupuis, A. (2011). Timelining: Visualizing
experience. Qualitative Research, 11(5),
552–569. https://doi.org/10.1177/1468794111413235
Social
Science Research Council & Qualitative Data Repository. (n.d.). Addressing copyright. Managing
Qualitative Social Science Data: An Interactive Online Course. https://managing-qualitative-data.org/modules/3/c/
Thygesen, M. K.,
Pedersen, B. D., Kragstrup, J., Wagner, L., & Mogensen, O. (2011). Utilizing a new graphical elicitation
technique to collect emotional narratives describing disease trajectories. The Qualitative Report, 16(2),
596–608. https://doi.org/10.46743/2160-3715/2011.1076
Wanberg, C. R., Ali, A.
A., & Csillag, B. (2020). Job seeking: The process and experience of
looking for a job. Annual Review of
Organizational Psychology and Organizational Behavior, 7,
315–337. https://doi.org/10.1146/annurev-orgpsych-012119-044939
Weak,
E. (2014, January 16). Getting your foot in the door: Moving from a world of
possibility to one of opportunity. Letters to a Young
Librarian. https://letterstoayounglibrarian.blogspot.com/2014/01/getting-your-foot-in-door-moving-from.html
Welsh,
M. E., McDonald, C., & Knievel, J. E. (2023). Cooking up something great: A
recipe for academic library CV content and structure. College & Research Libraries News, 84(9), 326–330. https://doi.org/10.5860/crln.84.9.326
Zoom
accessibility. (2024, April 23). In DLF Wiki. https://wiki.diglib.org/index.php?title=Zoom_Accessibility&oldid=16763