There's an App for That
Demystifying Infographics
Amy Trost
Data Services Librarian
Universities at Shady Grove/University of Maryland Libraries
Rockville, MD
atrost1@umd.edu
The first in a series of columns around data visualization by three librarians at the University of Maryland.
Data visualization is rapidly evolving and difficult to define. As a result, a research library’s role in supporting this work can be ambiguous. With infographics, for example, standard definitions do not exist, and there is not yet any consensus from the data visualization community around best practices for their creation. This column attempts to clarify some of this confusion by highlighting the spectrum of tools and techniques used for infographic creation.
For the purposes of this article, an infographic is defined as a visual display that combines data with descriptive text. Infographics can be static or interactive. Merriam Webster specifies that infographics should contain “graphic elements” that are “visually striking.” Hannah Rainey at the NC State Library defines infographics by what they do instead of what they are: they support an argument, raise awareness, educate, and tell a story. Lori Bruckner at UNC describes infographics as a type of data visualization and also mentions the importance of function as well as form; she writes that, “Infographics are usually meant to be entertaining and illustrative.”
This means that Alison Snyder and Lazaro Gamio’s visualization of space junk, while highly praised, is not an infographic because it is a single chart without extraneous visual elements (Figure 1). However, Agis Fasseas’ take on the same problem meets the definition of an infographic in both its simple thumbnail version and its longer, scrollable form (Figure 2).


Figures 1 & 2: Two visualizations on the same topic. Both provide useful information, but only the second visualization can be properly called an “infographic.” Image credits: Axios.com, Wordlesstech.com.
Overview of Tools
Data visualization tools are well documented in a growing number of library research guides. Custom infographics can be created with most of these programs. In addition, novice users can quickly design and distribute infographics with a growing number of design-specific web applications. Some of the most commonly used programs are described below.
- Infographic-specific tools. Dozens of these tools exist. Some are specifically geared to infographic creation while others support a wider range of visualizations. A free option with limited access is generally available, with a wider range of templates and functions accessible for a monthly fee. For infographics, Piktochart, Visme, and Easel.ly offer the broadest selection of images and templates, although users may want to browse the images available in a wide number of tools before selecting an option that suits their requirements.
- Static illustration tools. Microsoft PowerPoint has the graphic design functionality to support infographic creation from scratch, or users can take advantage of a series of infographic templates designed for PowerPoint by both Microsoft and external vendors. More customized image processing requires a vector graphics editor such as Adobe Illustrator. Part of Adobe’s Creative Cloud application, Illustrator is the industry standard and my program of choice for creating static infographics.
- Interactive visualization tools. Tableau allows users to create dynamic and interactive visualizations without users needing to learn a programming language. Tableau story points, in particular, are designed to present information in sequential order, like many infographics.
Users with coding experience may prefer to create static or interactive graphics in R or D3.js. While D3 is the most widely used dynamic visualization tool on the web, the R language underpins the infographics of several media outlets, including the BBC. Python programmers also have access to a growing number of visualization libraries.
Examples of Usage
While infographics and infographic-type visualizations have been in use for centuries (Friendly 2008), their ubiquitous presence online and in social media began in the early part of this decade (Google Trends 2019). Many newer infographics are formatted in a narrow, long format for easier consumption on mobile devices (see here for an example). And as dynamic visualizations become easier to produce with modern web browsers and standard libraries, a larger proportion of infographics feature some form of interactivity.
Here are three infographic examples from Kantar’s Information is Beautiful awards and Tableau’s Gallery.
1. Earth’s Temperature Timeline was published by Randal Munroe of xkcd in 2016:

Image credit: Randal Munroe. Used under CC-BY-NC-2.5 license.
2. Global Carbon Budget 2017 was edited by Pep Canadell, Robbie Andres, Glen Peters, and Corinne Le Quéré. It was distributed as a handout during the COP23 climate meeting:

Image credit: Editors - Pep Canadell; Robbie Andres; Glen Peters; Corinne Le Quéré. Used under CC-BY-NC-SA license.
3. Corey Jones’ Plant Medicine: The Effect of Cannabis on Epilepsy was a featured Tableau story in 2017:
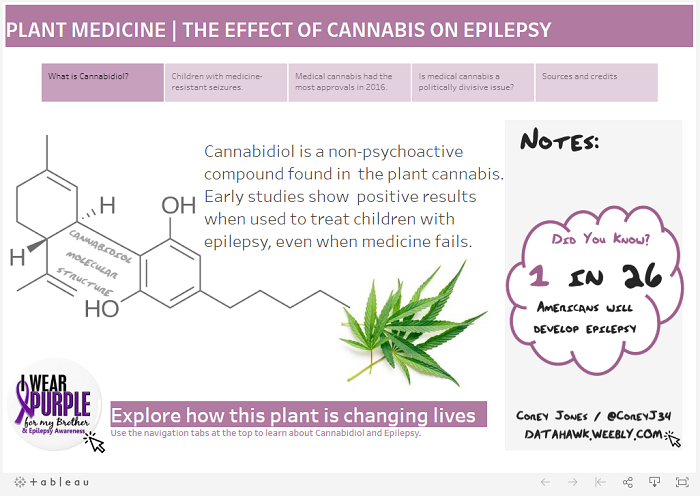
Image credit: Corey Jones. Used by permission.
Best Practices and Pitfalls
A strong infographic should have four elements:
- the right data,
- a compelling narrative,
- visuals that enhance without being distracting, and
- an accessible and shareable format.
These best practices are simple to articulate, but can be very difficult to achieve in practice. We have all seen our share of terrible infographics. Daniel Zeevi (Zeevi 2013) of Dashburst does a nice job of visualizing what can go wrong with infographics. I’ve reproduced his Venn diagram below:

In my mind, solid data is by far the most important of the four elements. Even though the circles above are the same size, Zeevi’s graphic illustrates this too. Note that the most unpleasant outcomes occur when an infographic does not contain the right data.
Nathan Yao emphasizes the importance of good data for effective design in a 2012 critique of some newly minted infographics tools:
Maybe I’m just stuck in my ways, but I’m having trouble getting on board with these tools…you start with a complete visual and then work your way backwards to the data...It’s rare that good graphics are produced when you go this direction. Instead, start with the data (or information) first and then build around that — don’t try to fit the data (or information) into a space it wasn’t meant for (Yao 2012).
While not all data can be visualized to tell a story, the data that can tell a story take many forms. Infographic data can be numeric, categorical, geographic, text, or simply a collection of facts. In their final, visualized form, these data can be used to compare and contrast, show networks, plot timelines, create flowcharts, map geographic relationships, or relate anecdotes (Penn Libraries n.d.).
Further Reading
Librarians who support data visualization do not need to be experts in making infographics. Instead, infographic support in the library could include the usual data analysis services—help with discovery, exploration, and evaluation—along with sharing knowledge about trends and resources for a rapidly evolving form of visualization.
How should librarians keep up with trends in infographics and the data visualization space more generally? It can be useful to follow emerging theories and research. For example:
- Northwestern University’s Visual Thinking Lab studies the neuroscience behind effective visualization.
- Data-Driven Storytelling, published by Riche et al in 2018, synthesizes perspectives from researchers and journalists.
- Many Medium communities publish data-related content. In particular, the Data Visualization Society’s Nightingale, launched in July of 2019, provides a space for dialogue within the data visualization community.
Another way to learn about changes in the field is by seeking out collections of high-quality infographics. There are scores of impressive examples online. Here are three of my favorites:
- FlowingData has been publishing many kinds of visualization examples, including infographics, for nearly a decade.
- While many major news sources have visualizations worth exploring, the New York Times is a leading producer of high-quality infographics.
- Storytelling with Data shows how individual or small groups of visualizations can be reworked to tell a story.
References
Friendly, M. 2008. A Brief History of Data Visualization. In: Chen C, Härdle W, Unwin A, editors. Handbook of Data Visualization. Berlin: Springer-Verlag. p. 15-56.
Google Trends. 2019. Search term: infographic. [Internet] [cited 2019 September 25]. Available from: https://trends.google.com/trends/explore?date=all&geo=US&q=infographic.
Penn Libraries Weigle Information Commons. n.d. Research Guides: Infographics. [Internet] [cited 2019 September 25]. Available from: https://guides.library.upenn.edu/infographics/overview.
Yao, Nathan. May 13, 2012. Automated Infographics With Easel.ly. FlowingData [Internet] [cited 2019 September 25]. Available from: https://flowingdata.com/2012/05/13/automated-infographics-with-easel-ly/.
Zeevi, Daniel. February 5, 2013. What Makes a Good Infographic? visual.ly [Internet] [cited 2019 September 25]. Available from: https://visual.ly/community/infographic/how/what-makes-good-infographic.

This work is licensed under a Creative Commons Attribution-NonCommercial 4.0 International License.
Issues in Science and Technology Librarianship No. 93, Winter 2019. DOI: 10.29173/istl47.