ResearchRabbit
is a scholarly publication discovery tool supported by artificial intelligence
(AI). It was developed in 2021 by a team of three in Seattle [1]. This tool lets users
discover publications related to one or more seed publications with the help of
visualization maps and lists of earlier, later, and similar publications.
ResearchRabbit is designed to support the workflow of unstructured searching while
providing a left-to-right trail from the original publication(s) through any
selected authors or publications. These trails, which can run as deep as rabbit
holes, suggest the origin of the tool’s name.
To
start using ResearchRabbit, users first need to create an account. Then they
need to create a collection and add at least one publication. The more
publications that are added, the better ResearchRabbit can understand users’
interests and generate recommendations similar to the contents of the collection.
Publications can be added either by uploading a RIS or BibTeX file or by using
ResearchRabbit’s search, powered by PubMed, if users are searching the medical
sciences, or Semantic Scholar, for any other subject area. While ResearchRabbit
uses PubMed’s and Semantic Scholar’s search engines, the company claims its
unique database of “100s of millions of academic articles” is second in size
only to Google Scholar [2].
Once
publications are in a collection, ResearchRabbit’s algorithm will begin
generating recommendations. These recommendations can be explored
through two modes: 1) by Papers that are Similar work, Earlier work, or
Later work or 2) by People that provide additional publications that
These authors or Suggested authors have published (Figure 1). These
recommendations are depicted using visualization maps.
Fig.
1 Different
exploration modes
Intended Users
ResearchRabbit is intended for any researcher conducting an unstructured
publication search. ResearchRabbit can be used for supplementary
searching to complement comprehensive database searches for users doing
knowledge synthesis projects.
Special Features
Visualization maps
Publication recommendations are presented as
visualization maps. There are two views for these maps. Network
view allows users to see publications that are connected to one another
(Figure 2). When choosing the options of earlier or later work,
publication recommendations are primarily based on citations. Similar
work relies more heavily on ResearchRabbit’s algorithm than on citations
to generate recommendations. In ResearchRabbit’s FAQ, the team says little
about the workings of the recommendation engine, briefly mentioning
citation networks and “some additional magic” [2]. Timeline view plots
publications by year, illustrating when the work was published in the
field (Figure 3). In both views, each publication is represented by a
node. Green nodes represent publications already in the user’s
collection and blue nodes are not in the collection. The darker shades
of blue represent more recent publications. Visualization maps can also
depict networks of collaborating authors, each of whom is represented by
a red node.
Fig. 2 Visualization map in
Network view
Fig. 3 Visualization map in
Timeline view
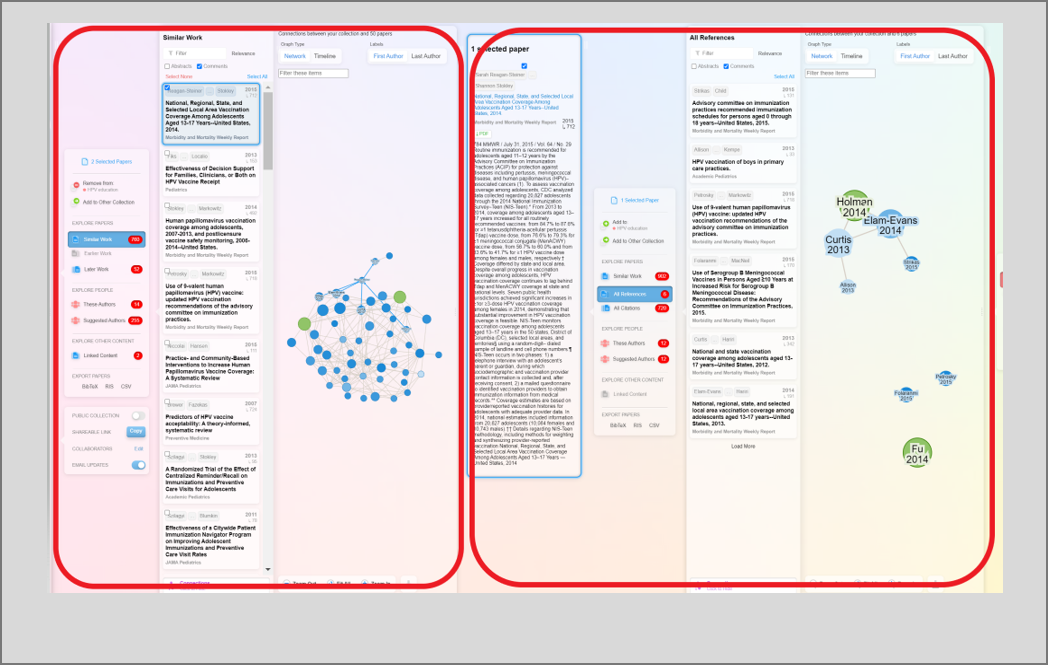
Unstructured searching workflow
Searching for literature can be haphazard,
specifically when users are not conducting searches for knowledge
synthesis projects. For example, a user might start skimming for
keywords in an article and then come across a prominent author in this
research field, which can lead to wanting to know all the publications
of this author and looking at the reference list for a newly discovered
article of interest. A challenge with this type of searching is that it
is possible to get lost down a rabbit hole of endless associated authors
and citations. ResearchRabbit supports this workflow and creates a
linear trail for wayfinding. A new panel opens to the right as a
different type of search is conducted (Figure 4). To find your way back,
scroll back to the left.
Fig. 4 Each panel represents a new search
Usability
ResearchRabbit is accessed via web browser without the need for
additional software. The site is generally navigable by keyboard
and with the aid of a screen reader. However, there are some navigation
challenges, including many buttons and a high volume of condensed
information presented by ResearchRabbit, which can make it difficult for
users to know where to begin.
Strengths
Visualization maps allow users to see connections between publications
or authors they may not otherwise notice. For example, when exploring by
authors, users can find research teams that they may not have been
aware of. The Similar Works feature may help unearth related
publications that would not be discovered with other search tools.
Weaknesses
ResearchRabbit has many different features, which can be overwhelming to
explore. A large initial time investment is required to learn the
different features to use ResearchRabbit to its maximum potential.
ResearchRabbit currently limits exploration to a
single linear path and leaves users to remember which branching paths of
authors and citations they have already explored. The interface does
not provide the means to save a rabbit hole for later exploration, nor
does it provide a means for users to mark publications they have already
come across, unless they are in one of the user’s collections.
The author visualization maps have some trouble with
author disambiguation. It is not uncommon in ResearchRabbit for a single
author to appear as two nodes in a collaboration network, each of which
is associated with different publication and citation numbers.
Cost/Value
At the
time of publication of this review, all features in ResearchRabbit are
free to use. The ResearchRabbit website insists that the tool will
remain “free forever for researchers” [2].
Comparison with Similar Products
Litmaps and Connected Papers are similar network map
visualization tools which allow for the discovery of other related
publications once a seed article is provided.
The key differences between these three tools are highlighted in Table 1.
Table 1 Comparison of ResearchRabbit, LitMaps and Connected Papers
Feature
ResearchRabbit
Litmaps
Connected Papers
Account requirements and cost
Account required
No cost, all features are available for all users
Account required
$120/year for Pro-version
Pro-version allows for:
Unlimited number of publications to be added for discovery maps
Enables filter features of the discover maps, which allows for much more in depth analysis [3].
Without an account, users can create 2 maps per month (free)
With an account, users can create 5 maps per month (free)
$ 36.00/year for academics
$120/year for businesses
With paid accounts, users can have unlimited number of maps per month
and have access to other features, such as saving newly discovered
publications through the maps [4].
Number of seed publications supported
At least one, no maximum number
Only supports one for a Seed map
Maximum of 20 (in the free version) for Discover map
One
Types of maps that can be created
Network and timeline maps can be viewed by authors or publications
Maps can toggle between “all citations”, “all references”, and “similar work”
Seed map- users add one seed publication. Litmaps will generate a map with suggested related publications.
Discover map- users can add more than one seed publication enabling a
more refined list of recommended publications compared to the seed map.
Map view- users can create maps based on publications they have
selected. No recommended publications are provided in this view. Map
view allows users to see the connections just between their selected
publications.
Only one type of map is created based on the one seed publication.
In a tabular format, users can also see publications that were most
cited by the seed publication under “Prior works” as well as
publications that cited the seed publication under “Derivative works”.
This information can only be downloaded in BibTeX format.
How are publications recommended?
Based on citations and AI
Based on citations of seed article
Co-citation and bibliographic coupling, meaning that if publications
have overlapping citations and references, they are more likely to be
recommended [4].
Conclusion
ResearchRabbit offers an extensive range of functions, which can be
overwhelming at first. However, once users overcome the learning
curve, ResearchRabbit can become a powerful discovery tool for
researchers doing unstructured searching. The various types of maps that
can be generated and the different views available in each map cater to
the needs of diverse users. Its use of AI makes the publication
recommendations unique compared to its competitors and provides users
with a more comprehensive set of recommended publications than users
would get otherwise.
Statement of Competing Interests
No competing interests declared.
Contact Information
Victoria Cole, BScN, MScN, MIS Research Librarian (Health Sciences) University of Ottawa
Email: vcole@uottawa.ca
Mish Boutet, BEd, MA, MIS Digital Literacy Librarian University of Ottawa Email: mboutet@uottawa.ca
References
1. Matthews
D. Drowning in the literature? These smart software tools can help.
Nature. 2021 Sep 1;597(7874):141–2. 2. ResearchRabbit [Internet]. ResearchRabbit. [cited
2023 May 3]. Available from: https://www.researchrabbit.ai 3. Litmaps: Pricing [Internet]. [cited 2023 Apr 19]. Available from: https://www.litmaps.com/pricing 4. Connected Papers: Find and explore academic papers
[Internet]. [cited 2023 Apr 19]. Available from:
https://www.connectedpapers.com/about